Bitcoin Cash price extended losses and traded below the $450 support. BCH is consolidating and might start a recovery wave if there is a move above $440.
Bitcoin cash price started a fresh decline below the $440 support.
The price is trading below $440 and the 100 simple moving average (4 hours).
There is a key bearish trend line forming with resistance at $438 on the 4-hour chart of the BCH/USD pair (data feed from Kraken).
The pair could start a decent upward move if it clears the $440 resistance zone.
In the past few days, there has been a steady decline in Bitcoin Cash price like Bitcoin and Ethereum. BCH declined below the $450 and $440 support levels to move into a short-term bearish zone.
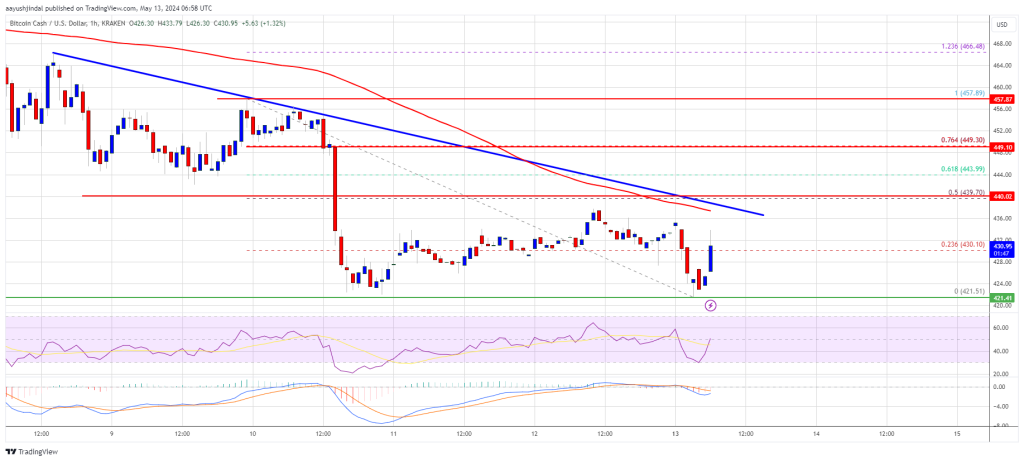
A low was formed at $421 and the price is now consolidating losses. There was a minor move above the $430 level. The price climbed above the 23.6% Fib retracement level of the downward move from the $457 swing high to the $421 low.
Bitcoin cash price is still trading below $440 and the 100 simple moving average (4 hours). Immediate resistance on the upside sits near the $438 level. There is also a key bearish trend line forming with resistance at $438 on the 4-hour chart of the BCH/USD pair.
Source: BCH/USD on TradingView.com
The trend line is close to the 50% Fib retracement level of the downward move from the $457 swing high to the $421 low. A clear move above the $440 resistance might start a decent increase. The next major resistance is near $4502, above which the price might accelerate higher toward the $465 level. Any further gains could lead the price toward the $480 resistance zone.
If Bitcoin Cash price fails to clear the $438 resistance, it could start a fresh decline. Initial support on the downside is near the $425 level.
The next major support is near the $420 level, where the bulls are likely to appear. If the price fails to stay above the $420 support, the price could test the $400 support. Any further losses could lead the price toward the $384 zone in the near term.
Technical indicators
4-hour MACD – The MACD for BCH/USD is losing pace in the bearish zone.
4-hour RSI (Relative Strength Index) – The RSI is currently in near the 50 level.
Key Support Levels – $425 and $420.
Key Resistance Levels – $440 and $450.
[#item_full_content]NewsBTCRead MoreIn his testimony on Tuesday, Federal Reserve Chair Jerome Powell dampened hopes for another round…
Bitcoin banks are going to happen. We already have a few of them. We’re going…
There have been recent concerns within the crypto community regarding Binance’s recent activities after a…
By launching its Macro Strategic Reserve, World Liberty Financial (WLFI) has advanced significantly and strengthened…
Bitcoin (BTC) continues to move within its one-week range after recovering from its recent drop…
Alexander Vinnik, the jailed former operator of once mighty bitcoin exchange BTC-e, is being released…