Bitcoin price recovered and climbed above the $64,000 resistance zone. BTC is now facing hurdles near the $65,500 and $66,000 levels.
Bitcoin is now struggling to gain pace for a move above the $65,500 resistance zone.
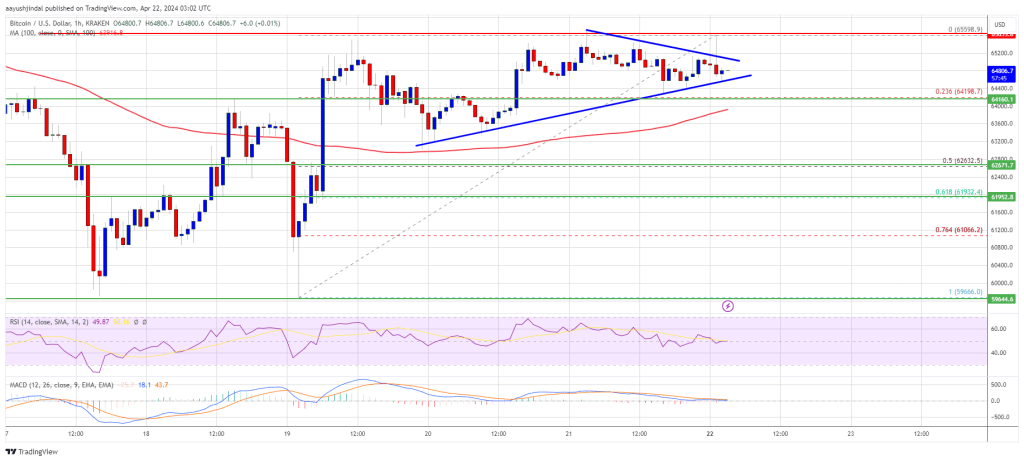
The price is trading above $64,000 and the 100 hourly Simple moving average.
There is a key contracting triangle forming with resistance at $65,100 on the hourly chart of the BTC/USD pair (data feed from Kraken).
The pair could start a fresh surge if it clears the $65,500 resistance zone.
Bitcoin price found support above $60,000 and started a fresh increase. BTC climbed above the $62,500 and $63,500 resistance levels. The bulls even pushed the price above the $65,000 level.
However, the bears seem to be active near the $65,500 zone. The recent high was formed at $65,598 and the price is now consolidating gains. There was a drop below the $65,000 level, but the price is still above the 23.6% Fib retracement level of the upward move from the $59,666 swing low to the $65,598 low.
Bitcoin price is trading above $64,000 and the 100 hourly Simple moving average. Immediate resistance is near the $65,100 level. There is also a key contracting triangle forming with resistance at $65,100 on the hourly chart of the BTC/USD pair.
The first major resistance could be $65,500. The next resistance now sits at $66,000. If there is a clear move above the $66,000 resistance zone, the price could continue to move up. In the stated case, the price could rise toward $67,500.
Source: BTCUSD on TradingView.com
The next major resistance is near the $68,500 zone. Any more gains might send Bitcoin toward the $70,000 resistance zone in the near term.
If Bitcoin fails to rise above the $65,500 resistance zone, it could start a downside correction. Immediate support on the downside is near the $64,500 level.
The first major support is $64,000. If there is a close below $64,000, the price could start to drop toward the 50% Fib retracement level of the upward move from the $59,666 swing low to the $65,598 low at $62,500. Any more losses might send the price toward the $61,200 support zone in the near term.
Technical indicators:
Hourly MACD – The MACD is now losing pace in the bullish zone.
Hourly RSI (Relative Strength Index) – The RSI for BTC/USD is now near the 50 level.
Major Support Levels – $64,500, followed by $64,000.
Major Resistance Levels – $65,100, $65,500, and $66,000.
[#item_full_content]NewsBTCRead MoreIn his testimony on Tuesday, Federal Reserve Chair Jerome Powell dampened hopes for another round…
Bitcoin banks are going to happen. We already have a few of them. We’re going…
There have been recent concerns within the crypto community regarding Binance’s recent activities after a…
By launching its Macro Strategic Reserve, World Liberty Financial (WLFI) has advanced significantly and strengthened…
Bitcoin (BTC) continues to move within its one-week range after recovering from its recent drop…
Alexander Vinnik, the jailed former operator of once mighty bitcoin exchange BTC-e, is being released…