Bitcoin Price Avoids Collapse But Can Bulls Clear This Major Hurdle?
Bitcoin price trimmed losses and climbed above $37,750. BTC gained pace but it is still struggling to clear the $38,500 resistance zone.
Bitcoin is again facing heavy resistance near the $38,500 zone.
The price is trading above $37,500 and the 100 hourly Simple moving average.
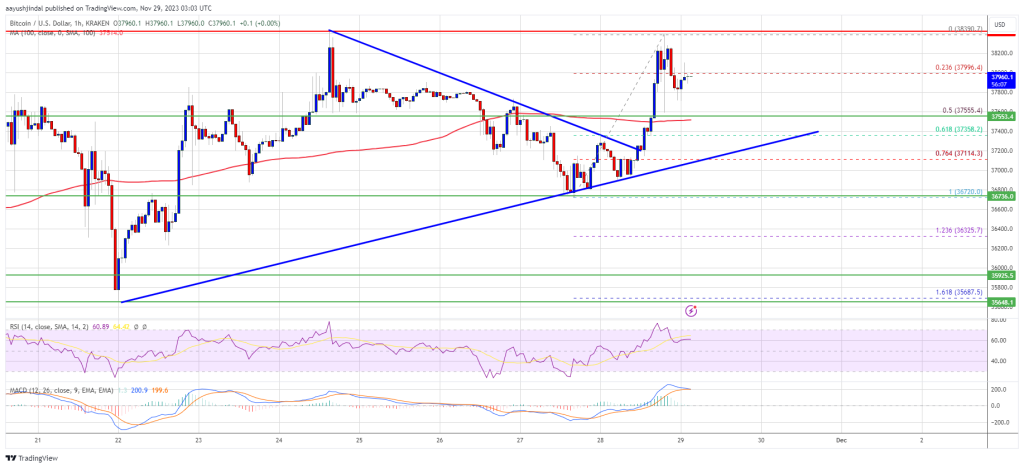
There was a break above a major bearish trend line with resistance near $37,250 on the hourly chart of the BTC/USD pair (data feed from Kraken).
The pair is struggling to clear the $38,500 resistance and correcting gains.
Bitcoin Price Extends Decline
Bitcoin price revisited the $36,720 support zone. BTC managed to avoid a collapse and started a fresh increase above the $37,000 level. There was a clear move above the $37,500 level.
Besides, there was a break above a major bearish trend line with resistance near $37,250 on the hourly chart of the BTC/USD pair. The pair surged above the $37,750 resistance. However, the bears were again active near the $38,500 resistance.
A high was formed near $38,390 and the price is now correcting gains. There was a move below the 23.6% Fib retracement level of the recent wave from the $36,720 swing low to the $38,390 high.
Bitcoin is now trading above $37,500 and the 100 hourly Simple moving average. On the upside, immediate resistance is near the $38,200 level. The first major resistance is forming near $38,400. The main resistance is now near the $38,500 level. A close above the $38,500 resistance might start a strong increase.
Source: BTCUSD on TradingView.com
The next key resistance could be near $39,200, above which BTC could rise toward the $39,500 level. Any more gains might send BTC toward the $40,000 resistance.
Another Drop In BTC?
If Bitcoin fails to rise above the $38,400 resistance zone, it could start another decline. Immediate support on the downside is near the $37,600 level.
The next major support is $37,500 or the 50% Fib retracement level of the recent wave from the $36,720 swing low to the $38,390 high. If there is a move below $37,500, there is a risk of more downsides. In the stated case, the price could drop toward the $36,720 support in the near term.
Technical indicators:
Hourly MACD – The MACD is now losing pace in the bullish zone.
Hourly RSI (Relative Strength Index) – The RSI for BTC/USD is now above the 50 level.
Major Support Levels – $37,600, followed by $37,500.
Major Resistance Levels – $38,400, $38,500, and $39,200.
[#item_full_content]NewsBTCRead More


Recent Posts
Bitcoin Hovers Above $94K as Market Awaits News on U.S.- China Trade Deal
Bitcoin (BTC) opened the trading week flat above $94,000 as traders waited for news from…
Bitcoin Price Eases From Highs — Support Zone Still Intact
Bitcoin price started a downside correction from the $97,800 zone. BTC is now trading below…
Bitcoin Hits 6-Month High In Active Addresses: Is $100K The Next Target?
Bitcoin bulls are trying to push higher from just under $97,000, attempting to confirm its…
Analyst Identifies When Bitcoin Price Will Reach Cycle Top — Here’s The Timeline
The Bitcoin price appeared to have reached its top in this current cycle, embarking on…
Bitcoin Traders’ Favorite Lottery Ticket for the First Half of the Year — The $300K BTC Call
In the crypto market, bold predictions aren’t just talk - they’re backed by real dollars,…
Chart of the Week: ’10x Money Multiplier’ for Bitcoin Could Take Wall Street by Storm
Adopting Michael Saylor's strategy of buying for the balance sheet has clearly taken off among…