Bitcoin Price Bounce Back: Could the Recovery Lose Momentum?
Bitcoin price started a recovery wave after it crashed below $50,000. BTC is back above $55,000 and faces many hurdles near the $58,000 zone.
Bitcoin started a recovery wave above the $52,500 and $55,000 levels.
The price is trading below $58,000 and the 100 hourly Simple moving average.
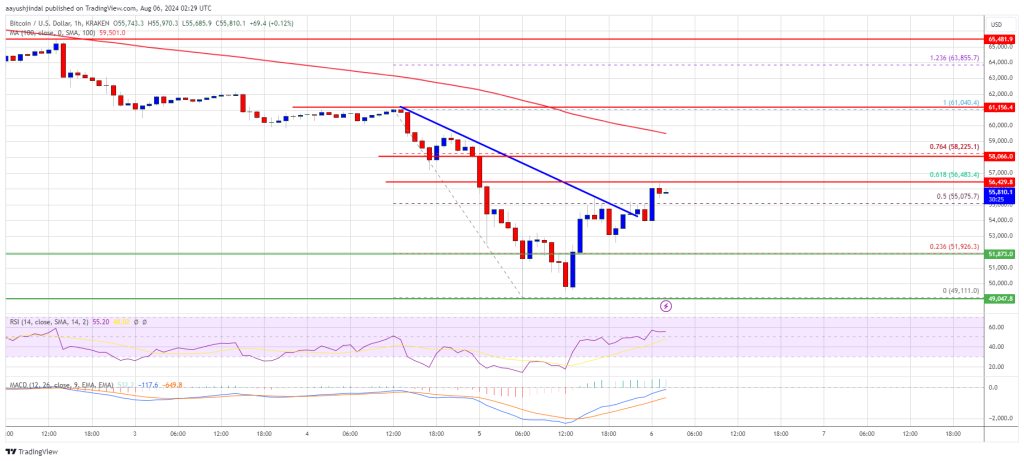
There was a break above a connecting bearish trend line with resistance at $55,100 on the hourly chart of the BTC/USD pair (data feed from Kraken).
The pair might struggle to clear the $58,000 resistance zone.
Bitcoin Price Starts Recovery Wave
Bitcoin price extended losses below the $52,500 support zone. BTC even traded below the $51,100 and $50,000 levels. A low was formed near $49,111 and the price recently started a recovery wave.
It recovered above the $52,500 level and tested the 50% Fib retracement level of the downward move from the $61,040 swing high to the $49,111 low. There was a break above a connecting bearish trend line with resistance at $55,100 on the hourly chart of the BTC/USD pair.
Bitcoin price is still trading below $58,000 and the 100 hourly Simple moving average. On the upside, the price could face resistance near the $56,500 level. It is near the 61.8% Fib retracement level of the downward move from the $61,040 swing high to the $49,111 low.
The first key resistance is near the $58,250 level. A clear move above the $58,250 resistance might send the price further higher in the coming sessions. The next key resistance could be $58,800.
The next major hurdle sits at $60,000. A close above the $60,000 resistance might spark bullish moves. In the stated case, the price could rise and test the $62,000 resistance.
Another Decline In BTC?
If Bitcoin fails to recover above the $58,000 resistance zone, it could start another decline. Immediate support on the downside is near the $55,000 level.
The first major support is $53,500. The next support is now near $52,000. Any more losses might send the price toward the $50,000 support zone in the near term.
Technical indicators:
Hourly MACD – The MACD is now gaining pace in the bullish zone.
Hourly RSI (Relative Strength Index) – The RSI for BTC/USD is now above the 50 level.
Major Support Levels – $55,000, followed by $53,500.
Major Resistance Levels – $56,500, and $58,000.
[#item_full_content]NewsBTCRead More


Recent Posts
Crypto Daybook Americas: PEPE Signals Altcoin Frenzy as Rampant Ether Outpaces Bitcoin
By Omkar Godbole (All times ET unless indicated otherwise) As the crypto rally gathers pace…
Bitcoin Sees Surge in Institutional Confidence, Deribit-Listed BTC Options Market Reveals
Bitcoin's (BTC) rally is gaining momentum, with institutions stepping up their exposure to the leading…
Bitcoin Derivatives In The Driver’s Seat For $100,000 Rally, Data Shows
Data shows the Bitcoin derivatives trading volume has been higher than the spot one during…
Massive Buy Pressure Hits Binance as Bitcoin Reclaims $100,000
Bitcoin’s price has finally reclaimed the $100,000 milestone after ranging below it for several weeks.…
Metaplanet Plans a Further $21M Bond Sale to Buy More BTC
Japanese hotel firm Metaplanet (3350) said it plans to sell another $21.25 million worth of…
9 of the Best Bitcoin Consultants To Help You Secure Your Bitcoin in 2025
Bitcoin Magazine 9 of the Best Bitcoin Consultants To Help You Secure Your Bitcoin in…