Bitcoin Price Breaking This Confluence Resistance Could Spark a Fresh Surge
Bitcoin price is currently consolidating below $20,650 against the US Dollar. BTC could start a fresh rally if it clears the 100 hourly SMA and then $20,650.
Bitcoin is holding gains above the key $20,250 and $20,000 support levels.
The price is trading below $20,650 and the 100 hourly simple moving average.
There is a key bearish trend line forming with resistance near $20,650 on the hourly chart of the BTC/USD pair (data feed from Kraken).
The pair could start another increase if it clears the 100 hourly SMA and $20,650.
Bitcoin Price Remains Stable
Bitcoin price found support near the $20,250 zone after a minor downside correction. BTC bulls were active above the $20,000 and $20,250 levels.
A low was formed near $20,250 before the price slowly moved higher. There was a move above the $20,450 resistance level. The price was able to clear the 23.6% Fib retracement level of the key drop from the $21,075 swing high to $20,250 low.
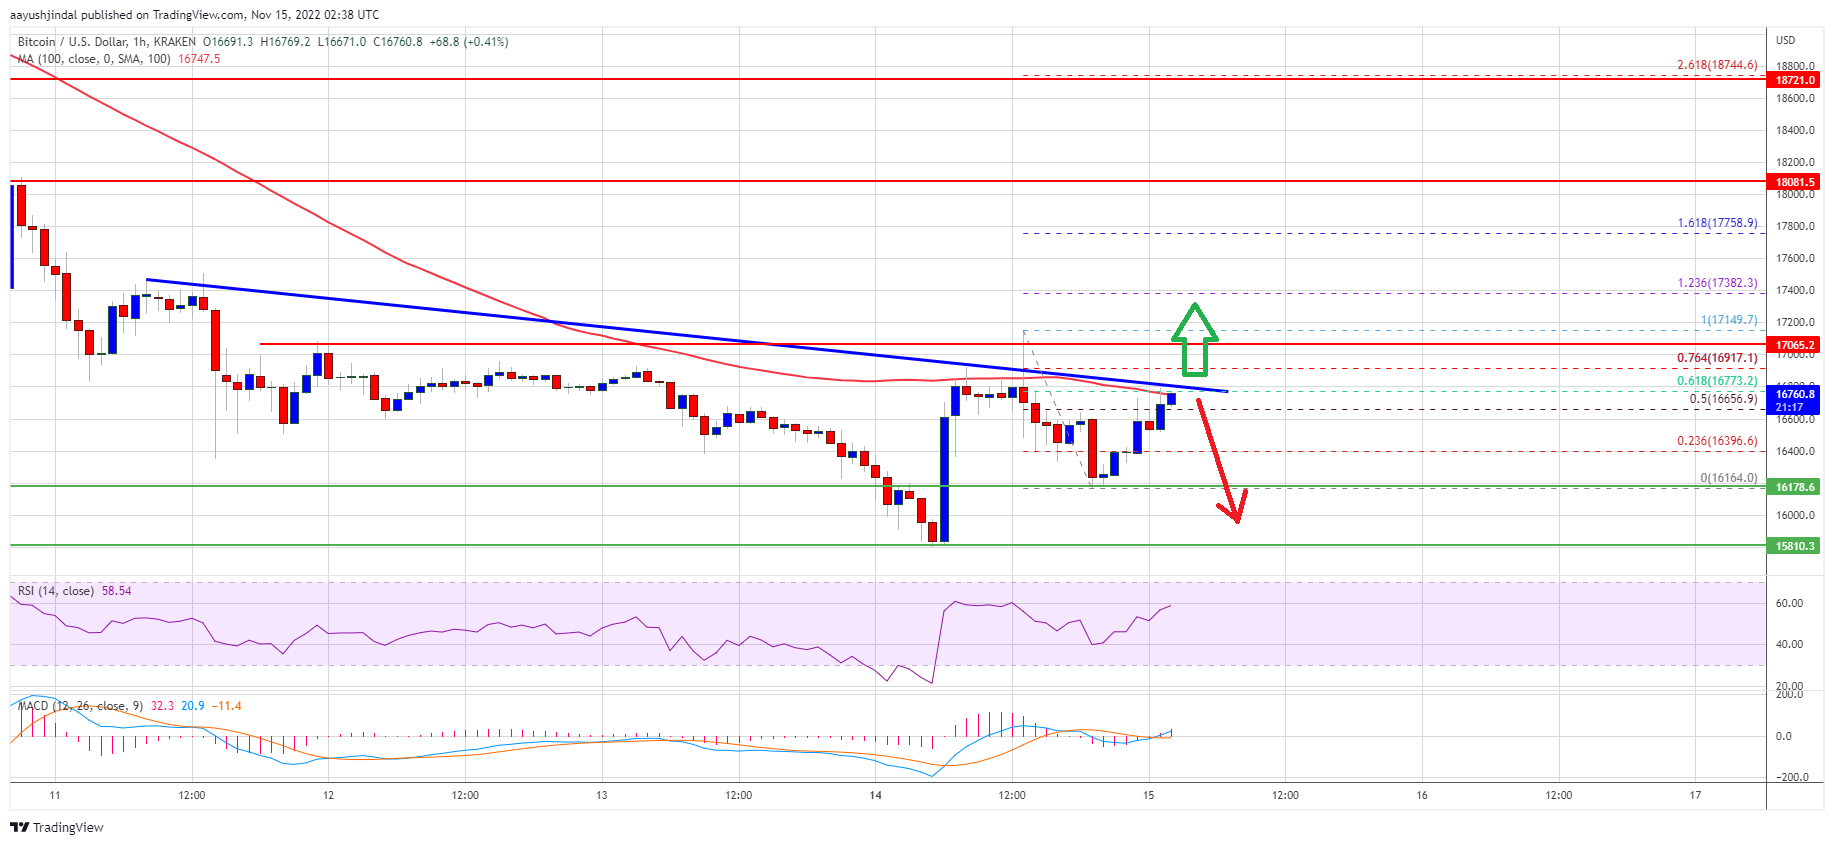
Bitcoin price is trading below $20,650 and the 100 hourly simple moving average. There is also a key bearish trend line forming with resistance near $20,650 on the hourly chart of the BTC/USD pair.
On the upside, an immediate resistance is near the $20,620 zone and the 100 hourly simple moving average. The first major resistance sits near the $20,650 level and the bearish trend line. The trend line is near the 50% Fib retracement level of the key drop from the $21,075 swing high to $20,250 low.
Source: BTCUSD on TradingView.com
A clear move above the $20,650 zone could send the price further higher. The next major resistance is still near $21,000, above which the price may perhaps start a fresh surge. In the stated case, the price may perhaps rise towards the $22,500 resistance zone.
More Losses in BTC?
If bitcoin fails to clear above the $20,650 resistance zone, it could slowly move lower. An immediate support on the downside is near the $20,320 zone.
The next major support is near the $20,250 zone. The main support sits at $20,000, below which the bears could aim a larger correction. In this case, the price may perhaps decline towards the $19,200 level.
Technical indicators:
Hourly MACD – The MACD is now losing pace in the bullish zone.
Hourly RSI (Relative Strength Index) – The RSI for BTC/USD is now near the 50 level.
Major Support Levels – $20,320, followed by $20,250.
Major Resistance Levels – $20,650, $20,700 and $21,000.
Bitcoin price is currently consolidating below $20,650 against the US Dollar. BTC could start a fresh rally if it clears the 100 hourly SMA and then $20,650.
Bitcoin is holding gains above the key $20,250 and $20,000 support levels.
The price is trading below $20,650 and the 100 hourly simple moving average.
There is a key bearish trend line forming with resistance near $20,650 on the hourly chart of the BTC/USD pair (data feed from Kraken).
The pair could start another increase if it clears the 100 hourly SMA and $20,650.
Bitcoin Price Remains Stable
Bitcoin price found support near the $20,250 zone after a minor downside correction. BTC bulls were active above the $20,000 and $20,250 levels.
A low was formed near $20,250 before the price slowly moved higher. There was a move above the $20,450 resistance level. The price was able to clear the 23.6% Fib retracement level of the key drop from the $21,075 swing high to $20,250 low.
Bitcoin price is trading below $20,650 and the 100 hourly simple moving average. There is also a key bearish trend line forming with resistance near $20,650 on the hourly chart of the BTC/USD pair.
On the upside, an immediate resistance is near the $20,620 zone and the 100 hourly simple moving average. The first major resistance sits near the $20,650 level and the bearish trend line. The trend line is near the 50% Fib retracement level of the key drop from the $21,075 swing high to $20,250 low.
Source: BTCUSD on TradingView.com
A clear move above the $20,650 zone could send the price further higher. The next major resistance is still near $21,000, above which the price may perhaps start a fresh surge. In the stated case, the price may perhaps rise towards the $22,500 resistance zone.
More Losses in BTC?
If bitcoin fails to clear above the $20,650 resistance zone, it could slowly move lower. An immediate support on the downside is near the $20,320 zone.
The next major support is near the $20,250 zone. The main support sits at $20,000, below which the bears could aim a larger correction. In this case, the price may perhaps decline towards the $19,200 level.
Technical indicators:
Hourly MACD – The MACD is now losing pace in the bullish zone.
Hourly RSI (Relative Strength Index) – The RSI for BTC/USD is now near the 50 level.
Major Support Levels – $20,320, followed by $20,250.
Major Resistance Levels – $20,650, $20,700 and $21,000.
Tags: bitcoinbtcusdBTCUSDTxbtusd
NewsBTCRead More


Recent Posts
Bitcoin Traders’ Favorite Lottery Ticket for the First Half of the Year — The $300K BTC Call
In the crypto market, bold predictions aren’t just talk - they’re backed by real dollars,…
Chart of the Week: ’10x Money Multiplier’ for Bitcoin Could Take Wall Street by Storm
Adopting Michael Saylor's strategy of buying for the balance sheet has clearly taken off among…
Bitcoin Spot ETFs Score $1.81 Billion In Net Inflows As Market Revival Continues
The US Bitcoin ETFs are strongly reflecting the bullish sentiments that are ravaging the crypto…
Bitcoin At $100K? $3 Billion In Shorts Are On The Line
Bitcoin is red hot again. Price reached $97,500 before dipping slightly lower to $97,000, and…
Michael Saylor’s $84 Billion Bitcoin Bet: How Is Strategy Doing On Its Current BTC Holdings?
Michael Saylor’s Bitcoin-first investment strategy has once again taken the spotlight after Strategy (formerly MicroStrategy)…
Bitcoin At Critical Juncture – Price Levels To Watch: Analyst
Bitcoin maintains its bullish form from April as it gains by over 4% in the…