Bitcoin Price Breaks Key Barrier And Aims Fresh Rally To $18K
Bitcoin price gained pace and cleared the $17,000 resistance. BTC is showing positive signs and might rise towards the $18,000 resistance.
Bitcoin started a fresh increase above the $16,800 and $17,000 resistance levels.
The price is trading above $16,800 and the 100 hourly simple moving average.
There is a major bullish trend line forming with support near $16,800 on the hourly chart of the BTC/USD pair (data feed from Kraken).
The pair could rise further towards the next hurdle near the $18,000 resistance.
Bitcoin Price Gains Momentum
Bitcoin price formed a support base above the $16,650 level. BTC remained well bid and started a fresh increase above the $16,800 and $17,000 resistance levels.
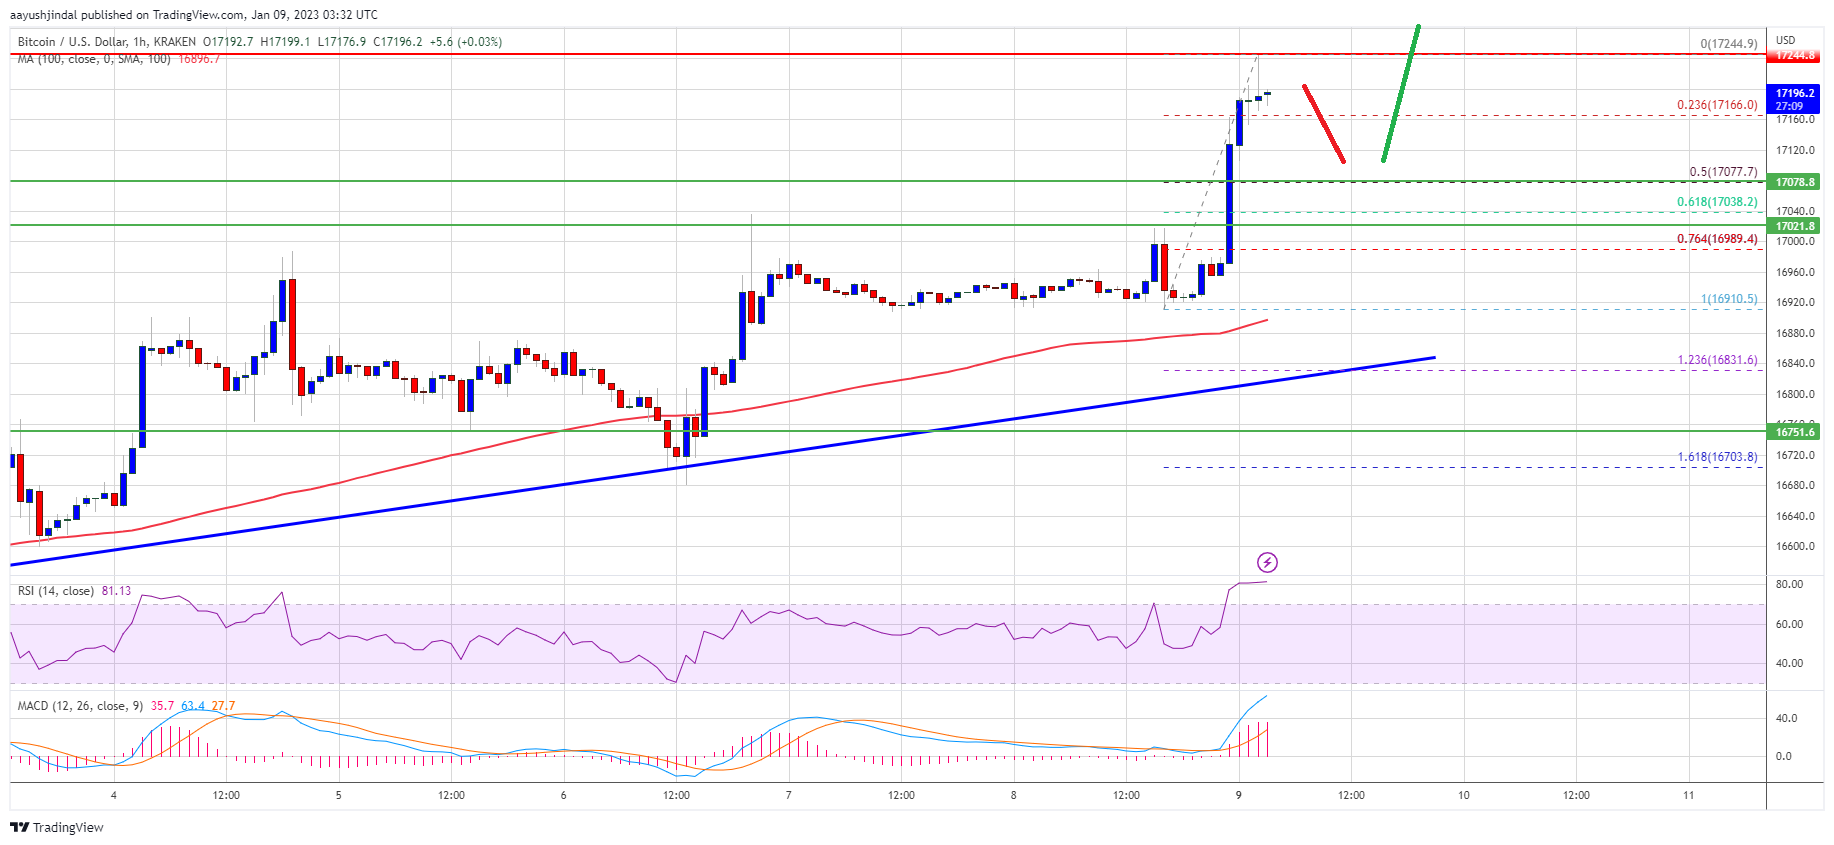
There was a close above the $17,000 level and the 100 hourly simple moving average. The price traded to a new yearly high at $17,244 and broke a major barrier. It is now consolidating gains above the $17,000 level. It is also trading above the 23.6% Fib retracement level of the upward move from the $16,910 swing low to $17,244 high.
Bitcoin price is now trading above $16,800 and the 100 hourly simple moving average. There is also a major bullish trend line forming with support near $16,800 on the hourly chart of the BTC/USD pair.
Source: BTCUSD on TradingView.com
On the upside, an immediate resistance is near the $17,250 level. The next major resistance is near the $17,500 zone. A clear move and close above the $17,500 resistance might start another rally in the near term. In the stated case, the price may perhaps rise towards the $18,000 level. Any more gains might call for a move towards the $18,500 level.
Dips Limited in BTC?
If bitcoin price fails to clear the $17,250 resistance, it could start a downside correction. An immediate support on the downside is near the $17,150 level.
The next major support is near the $17,000 level. It is near the 50% Fib retracement level of the upward move from the $16,910 swing low to $17,244 high. The main support is now forming near the $17,000 zone, below which the price might retest $16,800.
Technical indicators:
Hourly MACD – The MACD is now gaining pace in the bullish zone.
Hourly RSI (Relative Strength Index) – The RSI for BTC/USD is now above the 50 level.
Major Support Levels – $17,150, followed by $17,000.
Major Resistance Levels – $17,250, $17,500 and $18,000.
Bitcoin price gained pace and cleared the $17,000 resistance. BTC is showing positive signs and might rise towards the $18,000 resistance.
Bitcoin started a fresh increase above the $16,800 and $17,000 resistance levels.
The price is trading above $16,800 and the 100 hourly simple moving average.
There is a major bullish trend line forming with support near $16,800 on the hourly chart of the BTC/USD pair (data feed from Kraken).
The pair could rise further towards the next hurdle near the $18,000 resistance.
Bitcoin Price Gains Momentum
Bitcoin price formed a support base above the $16,650 level. BTC remained well bid and started a fresh increase above the $16,800 and $17,000 resistance levels.
There was a close above the $17,000 level and the 100 hourly simple moving average. The price traded to a new yearly high at $17,244 and broke a major barrier. It is now consolidating gains above the $17,000 level. It is also trading above the 23.6% Fib retracement level of the upward move from the $16,910 swing low to $17,244 high.
Bitcoin price is now trading above $16,800 and the 100 hourly simple moving average. There is also a major bullish trend line forming with support near $16,800 on the hourly chart of the BTC/USD pair.
Source: BTCUSD on TradingView.com
On the upside, an immediate resistance is near the $17,250 level. The next major resistance is near the $17,500 zone. A clear move and close above the $17,500 resistance might start another rally in the near term. In the stated case, the price may perhaps rise towards the $18,000 level. Any more gains might call for a move towards the $18,500 level.
Dips Limited in BTC?
If bitcoin price fails to clear the $17,250 resistance, it could start a downside correction. An immediate support on the downside is near the $17,150 level.
The next major support is near the $17,000 level. It is near the 50% Fib retracement level of the upward move from the $16,910 swing low to $17,244 high. The main support is now forming near the $17,000 zone, below which the price might retest $16,800.
Technical indicators:
Hourly MACD – The MACD is now gaining pace in the bullish zone.
Hourly RSI (Relative Strength Index) – The RSI for BTC/USD is now above the 50 level.
Major Support Levels – $17,150, followed by $17,000.
Major Resistance Levels – $17,250, $17,500 and $18,000.
Tags: bitcoinbitcoin pricebtcusdBTCUSDTxbtusd
NewsBTCRead More


Recent Posts
Bitcoin Rally Short-Circuited as Fed Chair Powell Raises Stagflation Fear
A modest bitcoin rally to a possible challenge of the $86,000 level quickly reversed during…
Bitcoin Price Following Analyst’s Prediction For Bullish Breakout, Here’s The Target
The Bitcoin price appears to be moving in lockstep with a bullish prediction made by…
Panama City Approves Bitcoin and Crypto Payments for Taxes, Fees, and Permits
Bitcoin Magazine Panama City Approves Bitcoin and Crypto Payments for Taxes, Fees, and Permits In…
How Expanding Global Liquidity Could Drive Bitcoin Price to New All-Time Highs
Bitcoin Magazine How Expanding Global Liquidity Could Drive Bitcoin Price to New All-Time Highs Bitcoin’s…
bitcoin++ mempools and mining edition: The Premier Developer-Centric Bitcoin Event Returns to Austin
Bitcoin Magazine bitcoin++ mempools and mining edition: The Premier Developer-Centric Bitcoin Event Returns to Austin…
Bull Bitcoin Expands to Mexico, Enabling Global Bitcoin Payments to Mexican Accounts
Bitcoin Magazine Bull Bitcoin Expands to Mexico, Enabling Global Bitcoin Payments to Mexican Accounts Bull…