Bitcoin price rallied further above the $37,200 resistance zone. BTC is now consolidating and might aim for more upsides above the $37,600 resistance zone.
Bitcoin started a strong increase above the $37,200 resistance zone.
The price is trading above $36,200 and the 100 hourly Simple moving average.
There is a major bullish trend line forming with support near $36,200 on the hourly chart of the BTC/USD pair (data feed from Kraken).
The pair is consolidating gains and might continue to rise toward $38,000.
Bitcoin price started a fresh increase above the $36,500 resistance zone. BTC gained pace for a clear move above the $37,200 resistance zone and rallied over 5%.
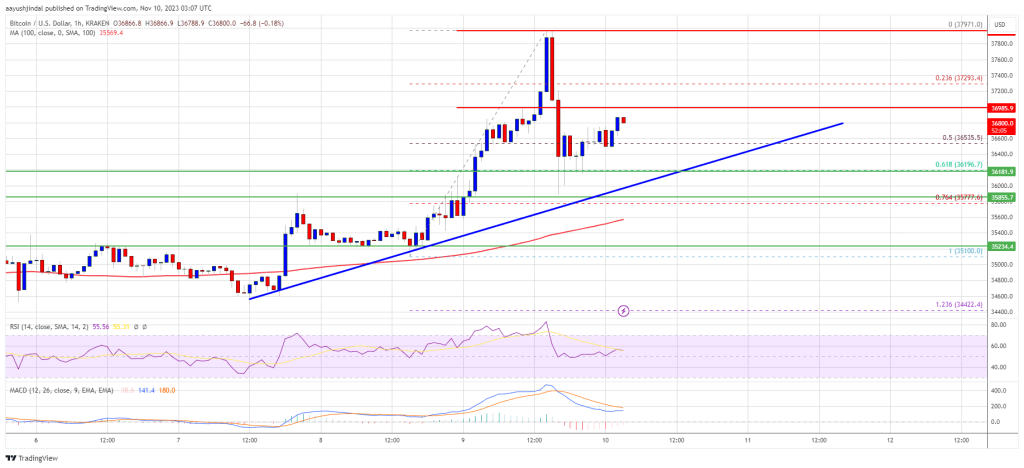
A new multi-week high was formed near $37,971 before there was a downside correction. There was a move below the $37,000 level. The price spiked below the 50% Fib retracement level of the upward move from the $35,100 swing low to the $37,971 high.
Bitcoin is now trading above $36,200 and the 100 hourly Simple moving average. There is also a major bullish trend line forming with support near $36,200 on the hourly chart of the BTC/USD pair.
The pair is also holding the 61.8% Fib retracement level of the upward move from the $35,100 swing low to the $37,971 high. It is now consolidating near the $36,750 level and is now attempting a fresh increase. On the upside, immediate resistance is near the $37,000 level.
Source: BTCUSD on TradingView.com
The next key resistance could be near $37,300, above which the price might accelerate further higher. In the stated case, it could test the $37,800 level. Any more gains might send BTC toward the $38,000 level.
If Bitcoin fails to rise above the $37,000 resistance zone, it could start a downside correction. Immediate support on the downside is near the $36,500 level.
The next major support is near the $36,200 zone or the trend line. If there is a move below $36,200, there is a risk of more downsides. In the stated case, the price could drop toward the key support at $35,500 in the near term.
Technical indicators:
Hourly MACD – The MACD is now gaining pace in the bullish zone.
Hourly RSI (Relative Strength Index) – The RSI for BTC/USD is now above the 50 level.
Major Support Levels – $36,500, followed by $36,200.
Major Resistance Levels – $37,000, $37,300, and $38,000.
[#item_full_content]NewsBTCRead MoreEthereum's ether (ETH) showed strength through the weekend, spurring investor hopes of a break in…
A fresh infusion of liquidity from the US Treasury General Account (TGA) is making waves…
Bitcoin has been stuck for the last three months, trading between $90K and $100K. It…
Litecoin has been gaining momentum in recent weeks, and according to crypto analyst Tony “The…
Bitcoin (BTC) miners listed in the U.S. are growing their share of the network hashrate,…
Metaplanet (3350) said it bought a further 269.43 bitcoin (BTC), strengthening its position as a…