Bitcoin Price Consolidates In Key Range, What Could Trigger Next Move
Bitcoin price is still facing resistance below $17,000. BTC could decline heavily if there is a clear move below the $16,000 support zone.
Bitcoin is still showing bearish signs below the $16,800 and $17,000 resistance levels.
The price is trading above $16,500 and the 100 hourly simple moving average.
There was a break above a key bearish trend line with resistance near $16,550 on the hourly chart of the BTC/USD pair (data feed from Kraken).
The pair could resume its decline if there is a clear move below the $16,000 support.
Bitcoin Price Remains In Downtrend
Bitcoin price spiked below the $16,500 support zone. However, BTC bulls were active above the $16,200 level. The price traded as low as $16,325 and recently started an upside correction.
There was a minor recovery wave above the $16,500 level. The price climbed above the $16,600 level and the 100 hourly simple moving average. However, the bears were active near the $16,680 zone. A high was formed near $16,683 and the price corrected lower.
Bitcoin price declined below 23.6% Fib retracement level of the upward move from the $16,325 low to $16,683 high. It found support near the $16,500 level.
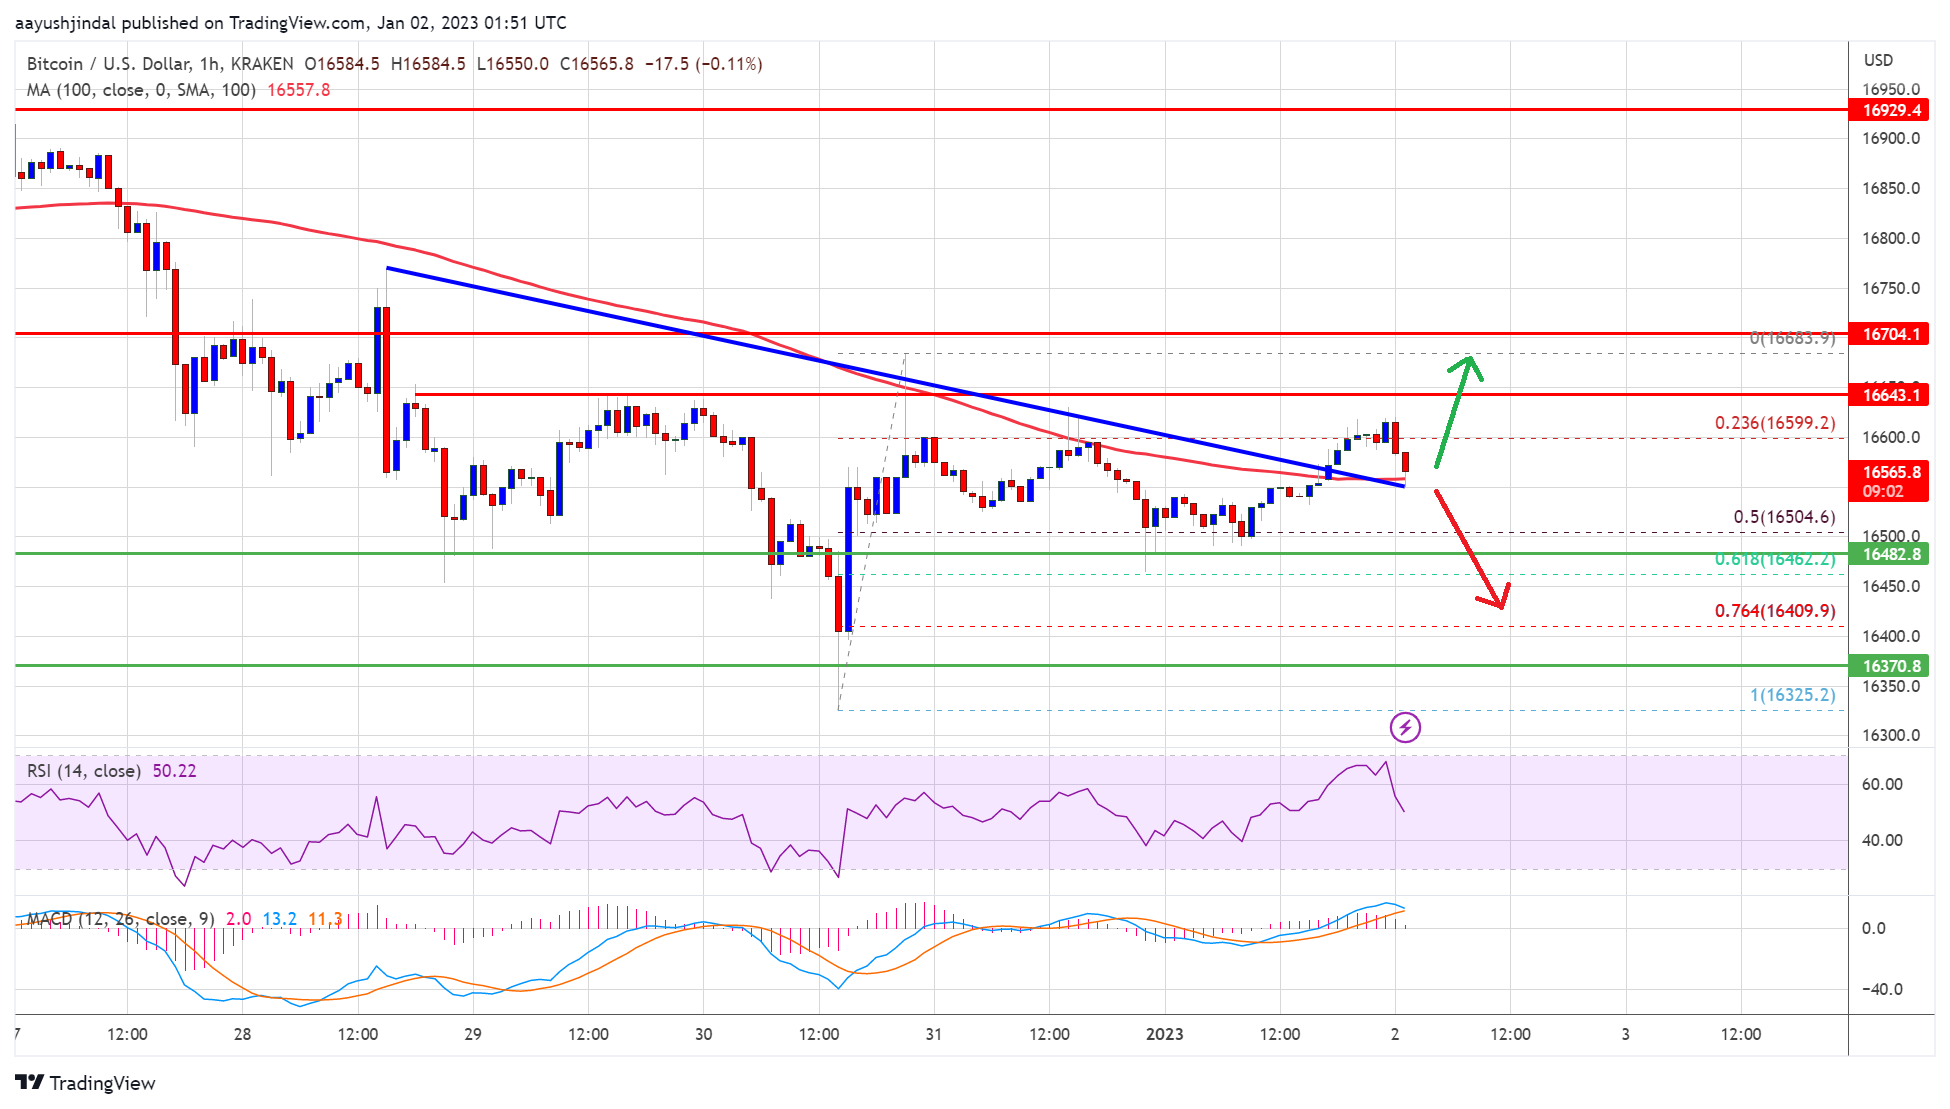
The price is trading above the 50% Fib retracement level of the upward move from the $16,325 low to $16,683 high. It is also above $16,500 and the 100 hourly simple moving average. On the upside, an immediate resistance is near the $16,600 level.
Source: BTCUSD on TradingView.com
The first major resistance is near the $16,680 zone. The next major resistance is near the $16,800 level. The key breakout zone is still near the $17,000 level. A clear move above the $17,000 resistance might start a fresh increase in the near term.
Fresh Decline in BTC?
If bitcoin fails to start a recovery wave above the $16,650 resistance, it could start another decline. An immediate support on the downside is near the $16,500 level.
The next major support is near the $16,350 level. A clear move below the $16,350 support might spark a move towards the $16,000 level. Any more losses might send the price towards $15,500.
Technical indicators:
Hourly MACD – The MACD is now losing pace in the bullish zone.
Hourly RSI (Relative Strength Index) – The RSI for BTC/USD is now near the 50 level.
Major Support Levels – $16,500, followed by $16,350.
Major Resistance Levels – $16,600, $16,800 and $17,000.
Bitcoin price is still facing resistance below $17,000. BTC could decline heavily if there is a clear move below the $16,000 support zone.
Bitcoin is still showing bearish signs below the $16,800 and $17,000 resistance levels.
The price is trading above $16,500 and the 100 hourly simple moving average.
There was a break above a key bearish trend line with resistance near $16,550 on the hourly chart of the BTC/USD pair (data feed from Kraken).
The pair could resume its decline if there is a clear move below the $16,000 support.
Bitcoin Price Remains In Downtrend
Bitcoin price spiked below the $16,500 support zone. However, BTC bulls were active above the $16,200 level. The price traded as low as $16,325 and recently started an upside correction.
There was a minor recovery wave above the $16,500 level. The price climbed above the $16,600 level and the 100 hourly simple moving average. However, the bears were active near the $16,680 zone. A high was formed near $16,683 and the price corrected lower.
Bitcoin price declined below 23.6% Fib retracement level of the upward move from the $16,325 low to $16,683 high. It found support near the $16,500 level.
The price is trading above the 50% Fib retracement level of the upward move from the $16,325 low to $16,683 high. It is also above $16,500 and the 100 hourly simple moving average. On the upside, an immediate resistance is near the $16,600 level.
Source: BTCUSD on TradingView.com
The first major resistance is near the $16,680 zone. The next major resistance is near the $16,800 level. The key breakout zone is still near the $17,000 level. A clear move above the $17,000 resistance might start a fresh increase in the near term.
Fresh Decline in BTC?
If bitcoin fails to start a recovery wave above the $16,650 resistance, it could start another decline. An immediate support on the downside is near the $16,500 level.
The next major support is near the $16,350 level. A clear move below the $16,350 support might spark a move towards the $16,000 level. Any more losses might send the price towards $15,500.
Technical indicators:
Hourly MACD – The MACD is now losing pace in the bullish zone.
Hourly RSI (Relative Strength Index) – The RSI for BTC/USD is now near the 50 level.
Major Support Levels – $16,500, followed by $16,350.
Major Resistance Levels – $16,600, $16,800 and $17,000.
Tags: bitcoinbitcoin pricebtcusdBTCUSDTxbtusd
NewsBTCRead More


Recent Posts
Bitcoin Price Suppression Below $100,000 Worries Investors, JPMorgan Analysts Reveal Real Problem
Bitcoin’s price rally may be under threat as it continues to trade under $100,000. According…
Bitcoin Bearish Case Emerges – Is A Dump To $73,000 Coming?
A new technical analysis on TradingView suggests Bitcoin may be approaching a decisive moment, with…
Bitcoin’s Bullish Case Hinges On $94,645 Support: Will Buyers Step In?
The Bitcoin market continued to struggle in February marked by a high level of investor…
Bitcoin Faces Serious Price Compression – What Happened Last Time
Bitcoin has experienced a tiring price action in recent weeks, with the price struggling to…
Bitcoin’s Grip Tightens — CZ Says There’s ‘No Escape’ From Crypto
A former cryptocurrency exchange executive remarked that Bitcoin is an inescapable reality, a statement that…
As Bitcoin Sell Pressure Fades, Could A Local Bottom Be Forming? Analyst Explains
According to an X post by crypto analyst Ali Martinez, Bitcoin (BTC) is witnessing a…