Bitcoin Price Consolidates – Why 100 SMA Could Spark Fresh Increase
Bitcoin price failed again to clear the $38,500 resistance zone. BTC is consolidating above the 100 hourly SMA and might attempt another increase.
Bitcoin is still facing heavy resistance near the $38,500 zone.
The price is trading above $37,400 and the 100 hourly Simple moving average.
There is a key bullish trend line forming with support near $37,350 on the hourly chart of the BTC/USD pair (data feed from Kraken).
The pair could make another attempt to clear the $38,500 resistance unless it breaks below $37,350.
Bitcoin Price Holds Support
Bitcoin price remained well-bid above the $37,500 support zone. BTC climbed higher above the $38,000 level and made another attempt to clear the $38,400 resistance zone.
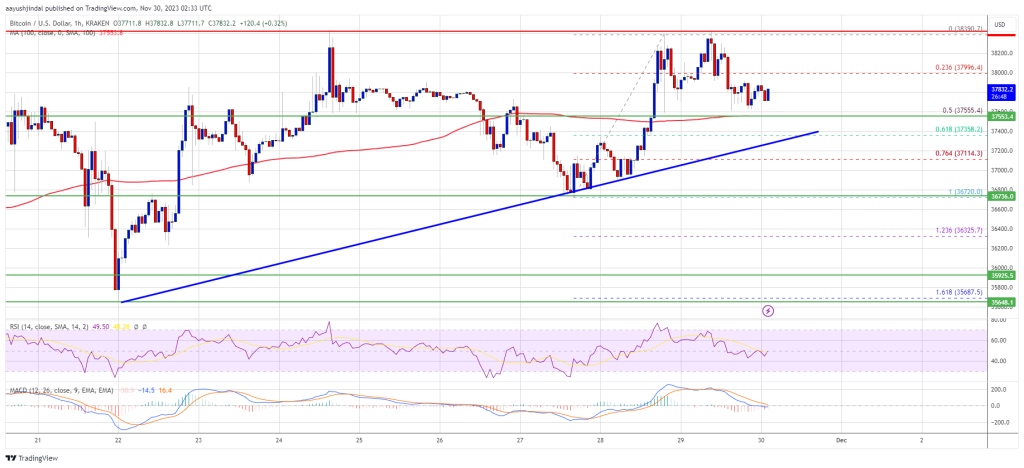
However, the bulls failed to gain strength and the price peaked near $38,400. It is again correcting gains and trading below the 23.6% Fib retracement level of the upward move from the $36,721 swing low to the $38,390 high.
Bitcoin is now trading above $37,400 and the 100 hourly Simple moving average. There is also a key bullish trend line forming with support near $37,350 on the hourly chart of the BTC/USD pair.
On the upside, immediate resistance is near the $38,200 level. The first major resistance is forming near $38,400. The main resistance is still near the $38,500 level. A close above the $38,500 resistance might start a fresh rally.
Source: BTCUSD on TradingView.com
The next key resistance could be near $39,200, above which BTC could climb toward the $39,500 level. Any more gains might send BTC toward the $40,000 resistance.
More Losses In BTC?
If Bitcoin fails to rise above the $38,400 resistance zone, it could start another decline. Immediate support on the downside is near the $37,550 level or the 50% Fib retracement level of the upward move from the $36,721 swing low to the $38,390 high.
The next major support is near $37,350 and the trend line. If there is a move below $37,350, there is a risk of more downsides. In the stated case, the price could decline toward the $36,720 support in the near term.
Technical indicators:
Hourly MACD – The MACD is now losing pace in the bullish zone.
Hourly RSI (Relative Strength Index) – The RSI for BTC/USD is now near the 50 level.
Major Support Levels – $37,550, followed by $37,350.
Major Resistance Levels – $38,400, $38,500, and $39,200.
[#item_full_content]NewsBTCRead More


Recent Posts
Bitcoin Price Outlook: Will BTC Rebound Or Drop To $76,000?
The price of Bitcoin (BTC) has shown only sideways movement in the last day resulting…
Bitcoin Network Activity Is Declining — Impact On Price?
A sluggish Bitcoin price performance has not been the only disappointing theme for the largest…
Best Cryptocurrencies to Buy as Trump’s WLFI Increases Holdings in $WBTC and $MOVE
World Liberty Financial, Trump’s crypto company, is making moves again. It recently bought another $1.4M…
Strategy Could Be Eligible for S&P 500 Inclusion in June if Bitcoin Closes Q1 Above $96K
Disclaimer: The analyst who wrote this piece owns shares of Strategy (MSTR) Strategy (MSTR) could…
No $200K Bitcoin? Popular Trader Explains Why It’s Unlikely This Decade
Peter Brandt, a seasoned trader, has dismissed optimistic predictions in the wake of Bitcoin’s recent…
El Salvador Dispatch: How Bitcoin Taught a Nation to Dream
This article is part of a four-piece series on El Salvador. You can find the…