Bitcoin price recovered above the $60,000 resistance zone. BTC is now struggling to clear the $61,200 and $61,500 resistance levels.
Bitcoin started a recovery wave above the $60,000 resistance zone.
The price is trading above $60,000 and the 100 hourly Simple moving average.
There was a break above a connecting bearish trend line with resistance at $59,500 on the hourly chart of the BTC/USD pair (data feed from Kraken).
The pair might attempt a fresh increase if it settles above the $61,500 resistance zone.
Bitcoin price started a decent upward move above the $58,500 resistance zone. BTC was able to clear the $59,500 and $60,000 resistance levels.
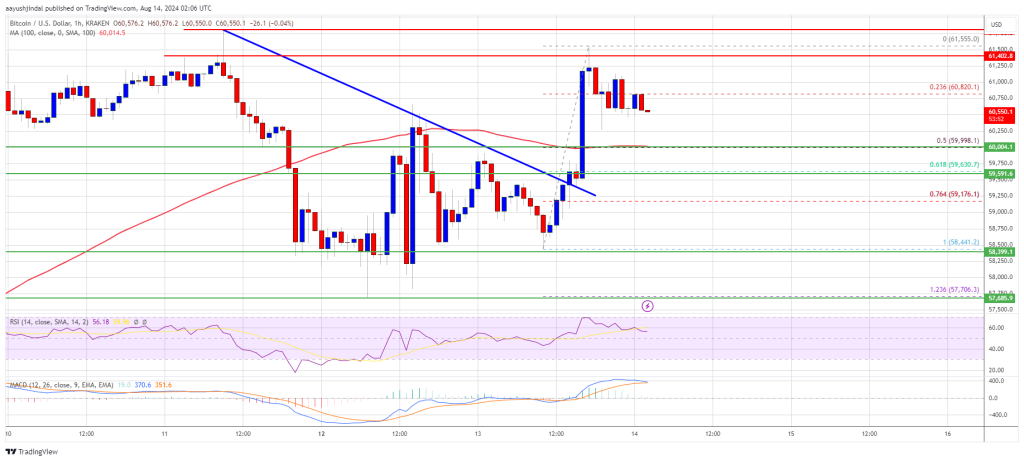
There was a break above a connecting bearish trend line with resistance at $59,500 on the hourly chart of the BTC/USD pair. It even spiked above the $61,500 level. A high was formed at $61,555 and the price is now correcting gains.
There was a move below the $61,200 and $61,000 levels. The price dipped below the 23.6% Fib retracement level of the upward move from the $58,441 swing low to the $61,555 high.
Bitcoin price is now trading above $60,000 and the 100 hourly Simple moving average. It is also well above the 50% Fib retracement level of the upward move from the $58,441 swing low to the $61,555 high. On the upside, the price could face resistance near the $61,200 level.
The first key resistance is near the $61,500 level. A clear move above the $61,500 resistance might send the price further higher in the coming sessions. The next key resistance could be $62,500.
The next major hurdle sits at $63,500. A close above the $63,500 resistance might spark more upsides. In the stated case, the price could rise and test the $65,000 resistance.
If Bitcoin fails to rise above the $61,500 resistance zone, it could start another decline. Immediate support on the downside is near the $60,000 level and the 100 hourly Simple moving average.
The first major support is $59,650. The next support is now near the $59,150 zone. Any more losses might send the price toward the $58,500 support zone or even $57,200 in the near term.
Technical indicators:
Hourly MACD – The MACD is now losing pace in the bullish zone.
Hourly RSI (Relative Strength Index) – The RSI for BTC/USD is now above the 50 level.
Major Support Levels – $60,000, followed by $59,650.
Major Resistance Levels – $61,200, and $61,500.
[#item_full_content]NewsBTCRead MoreThe Bitcoin price action this weekend has been quite bubbly and impressive, with the premier…
Bitcoin (BTC) proponent Michael Saylor has hinted the company he co-founded, Strategy (MSTR), may be…
The price of Bitcoin has found its way back above the $85,000 mark, marking a…
Bitcoin has broken out of a technical formation that may place it on track toward…
Prominent X market analyst Cryptododo7 has shared a bearish prediction on the Bitcoin market amidst…
Technical expert Tony Severino has warned that the Bitcoin/VIX is not as bullish as market…