Bitcoin Price Dumped To $66K As Bears Gain Strength, $64K Next?
Bitcoin price started another decline from the $70,000 resistance zone. BTC is down over 5% and there was a move below the $67,500 support.
Bitcoin price is gaining bearish momentum from the $70,000 resistance zone.
The price is trading below $68,500 and the 100 hourly Simple moving average.
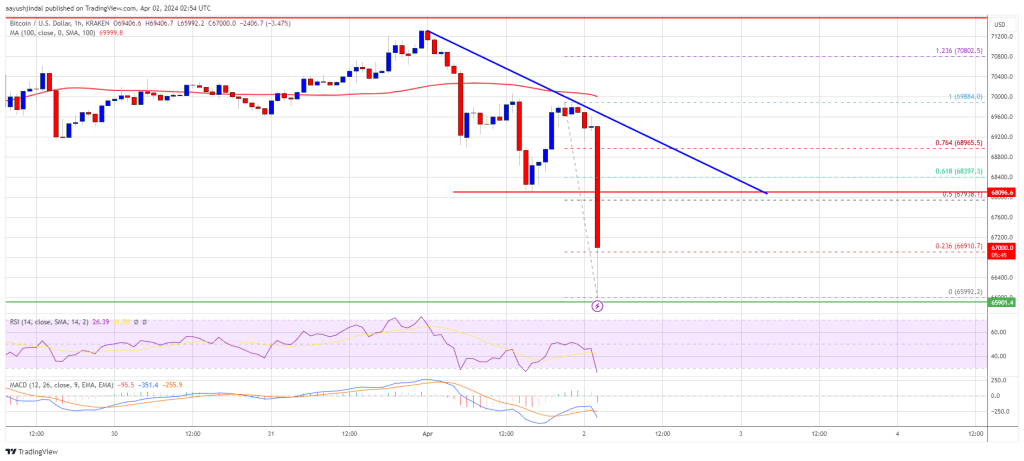
There is a key bearish trend line forming with resistance near $68,400 on the hourly chart of the BTC/USD pair (data feed from Kraken).
The pair could extend its decline toward the $64,000 support zone in the near term.
Bitcoin Price Turns Red
Bitcoin price struggled to settle above the $70,000 resistance zone. BTC reacted to the downside after it broke the $69,200 support zone. There was a sharp move below the $68,500 level.
The price even declined below the $67,000 level. Finally, it tested the $66,000 with a bearish angle. A low was formed near $65,992 and the price is now attempting a recovery wave. There was a move above the $66,800 level.
The price moved above the 23.6% Fib retracement level of the downward move from the $69,884 swing high to the $65,992 low. However, Bitcoin is now trading below $68,500 and the 100 hourly Simple moving average. There is also a key bearish trend line forming with resistance near $68,400 on the hourly chart of the BTC/USD.
Immediate resistance is near the $68,000 level. It is close to the 50% Fib retracement level of the downward move from the $69,884 swing high to the $65,992 low. The first major resistance could be $68,500 and the trend line. If there is a clear move above the $68,500 resistance zone, the price could start a fresh increase.
Source: BTCUSD on TradingView.com
In the stated case, the price could rise toward the $70,000 resistance zone in the near term. The next major resistance is near the $71,500 zone.
More Losses In BTC?
If Bitcoin fails to rise above the $68,000 resistance zone, it could continue to move down. Immediate support on the downside is near the $66,000 level.
The first major support is $65,000. The next support sits at $64,000. If there is a close below $64,000, the price could start a drop toward the $62,500 level. Any more losses might send the price toward the $60,500 support zone in the near term.
Technical indicators:
Hourly MACD – The MACD is now gaining pace in the bearish zone.
Hourly RSI (Relative Strength Index) – The RSI for BTC/USD is now below the 50 level.
Major Support Levels – $66,000, followed by $65,000.
Major Resistance Levels – $68,000, $68,500, and $70,000.
[#item_full_content]NewsBTCRead More


Recent Posts
Crypto Daybook Americas: Trump’s Fed Outburst Fails to Jolt Bitcoin
Welcome to your Good Friday edition of the daybook. With markets on a shortened schedule…
How Bitcoin Offers a Speed Advantage for Driving Shareholder Value
Bitcoin Magazine How Bitcoin Offers a Speed Advantage for Driving Shareholder Value Bitcoin is the…
Bitcoin In Peril? Expert Warns Of China’s Alleged Scheme To Crash BTC To $40,000
As Bitcoin (BTC) attempts to stabilize above the crucial $80,000 support level, a new warning…
This Bitcoin Bear Confirmation Is Yet To Appear, Glassnode Reveals
The on-chain analytics firm Glassnode has revealed in a report how this historical bear market…
Is This the Final Shakeout Before Bitcoin’s Next Big Move? Analysts Break It Down
Bitcoin’s recent price action has shown signs of stagnation, with the asset hovering around the…
Bitcoin Recovery in Motion? Analyst Tracks Key Divergence Between US and Asia Market
Bitcoin appears to be entering a period of consolidation following a brief burst of upward…