Bitcoin Price Eyes Upside Break: Is a Bullish Move Ahead?
Bitcoin price stayed above the $57,650 support zone. BTC is now rising and might aim for a move above the $60,000 resistance zone.
Bitcoin started a recovery wave above the $58,500 resistance zone.
The price is trading below $60,000 and the 100 hourly Simple moving average.
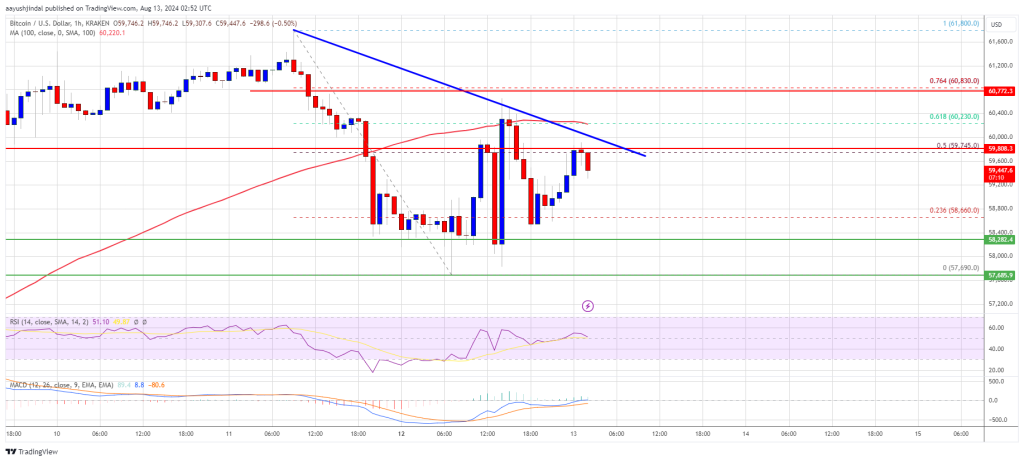
There is a connecting bearish trend line forming with resistance at $60,000 on the hourly chart of the BTC/USD pair (data feed from Kraken).
The pair might attempt a fresh increase if it settles above the $60,000 resistance zone.
Bitcoin Price Eyes Another Increase
Bitcoin price started a downside correction below the $60,000 level. BTC declined below the $59,500 and $58,000 levels to move into a short-term bearish zone. A low was formed at $57,690 and the price recently started a recovery wave.
There was a move above the $58,000 and $58,500 levels. The price climbed above the 50% Fib retracement level of the downward move from the $61,800 swing high to the $57,690 swing low.
Bitcoin price is now trading below $60,000 and the 100 hourly Simple moving average. On the upside, the price could face resistance near the $60,000 level. There is also a connecting bearish trend line forming with resistance at $60,000 on the hourly chart of the BTC/USD pair.
The first key resistance is near the $60,250 level. It is close to the 61.8% Fib retracement level of the downward move from the $61,800 swing high to the $57,690 swing low. A clear move above the $60,250 resistance might send the price further higher in the coming sessions. The next key resistance could be $61,200.
The next major hurdle sits at $62,500. A close above the $62,500 resistance might spark more upsides. In the stated case, the price could rise and test the $64,200 resistance.
Another Decline In BTC?
If Bitcoin fails to rise above the $60,000 resistance zone, it could start another decline. Immediate support on the downside is near the $58,800 level.
The first major support is $57,650. The next support is now near the $57,000 zone. Any more losses might send the price toward the $55,500 support zone or even $55,000 in the near term.
Technical indicators:
Hourly MACD – The MACD is now gaining pace in the bullish zone.
Hourly RSI (Relative Strength Index) – The RSI for BTC/USD is now above the 50 level.
Major Support Levels – $58,500, followed by $57,650.
Major Resistance Levels – $60,000, and $60,250.
[#item_full_content]NewsBTCRead More


Recent Posts
Massive Buy Pressure Hits Binance as Bitcoin Reclaims $100,000
Bitcoin’s price has finally reclaimed the $100,000 milestone after ranging below it for several weeks.…
Metaplanet Plans a Further $21M Bond Sale to Buy More BTC
Japanese hotel firm Metaplanet (3350) said it plans to sell another $21.25 million worth of…
9 of the Best Bitcoin Consultants To Help You Secure Your Bitcoin in 2025
Bitcoin Magazine 9 of the Best Bitcoin Consultants To Help You Secure Your Bitcoin in…
Trump’s $6 Billion Trade Deal With The UK Pushes Bitcoin Past $100,000
Bitcoin (BTC), the market’s leading cryptocurrency, has surpassed the $100,000 mark for the first time…
Bitcoin’s Price Surge to $104K Liquidates Nearly $400M in Bearish BTC Bets, Opening Doors to Further Gains
Bitcoin's rapid price rally has caught traders off guard, triggering large liquidations of bearish short…
Bitcoin Resistance Limited Beyond $100,000, On-Chain Data Suggests
On-chain data suggests Bitcoin may encounter low resistance at $100,000 and beyond, at least from…