Bitcoin Price Faces Hurdle And Remains At Risk of Additional Losses
Bitcoin price is correcting losses from the $27,660 zone. BTC is now facing strong resistance near the $28,800 and $29,000 levels.
Bitcoin is attempting a fresh increase above the $28,500 resistance zone.
The price is trading below $28,800 and the 100 hourly Simple moving average.
There is a connecting bullish trend line forming with support near $28,200 on the hourly chart of the BTC/USD pair (data feed from Kraken).
The pair could decline again if it fails to surpass the $28,800 resistance zone.
Bitcoin Price Upsides Capped
Bitcoin price formed a base and started a recovery wave above the $28,000 resistance zone. BTC climbed above the $28,200 resistance zone to move into a short-term bullish zone.
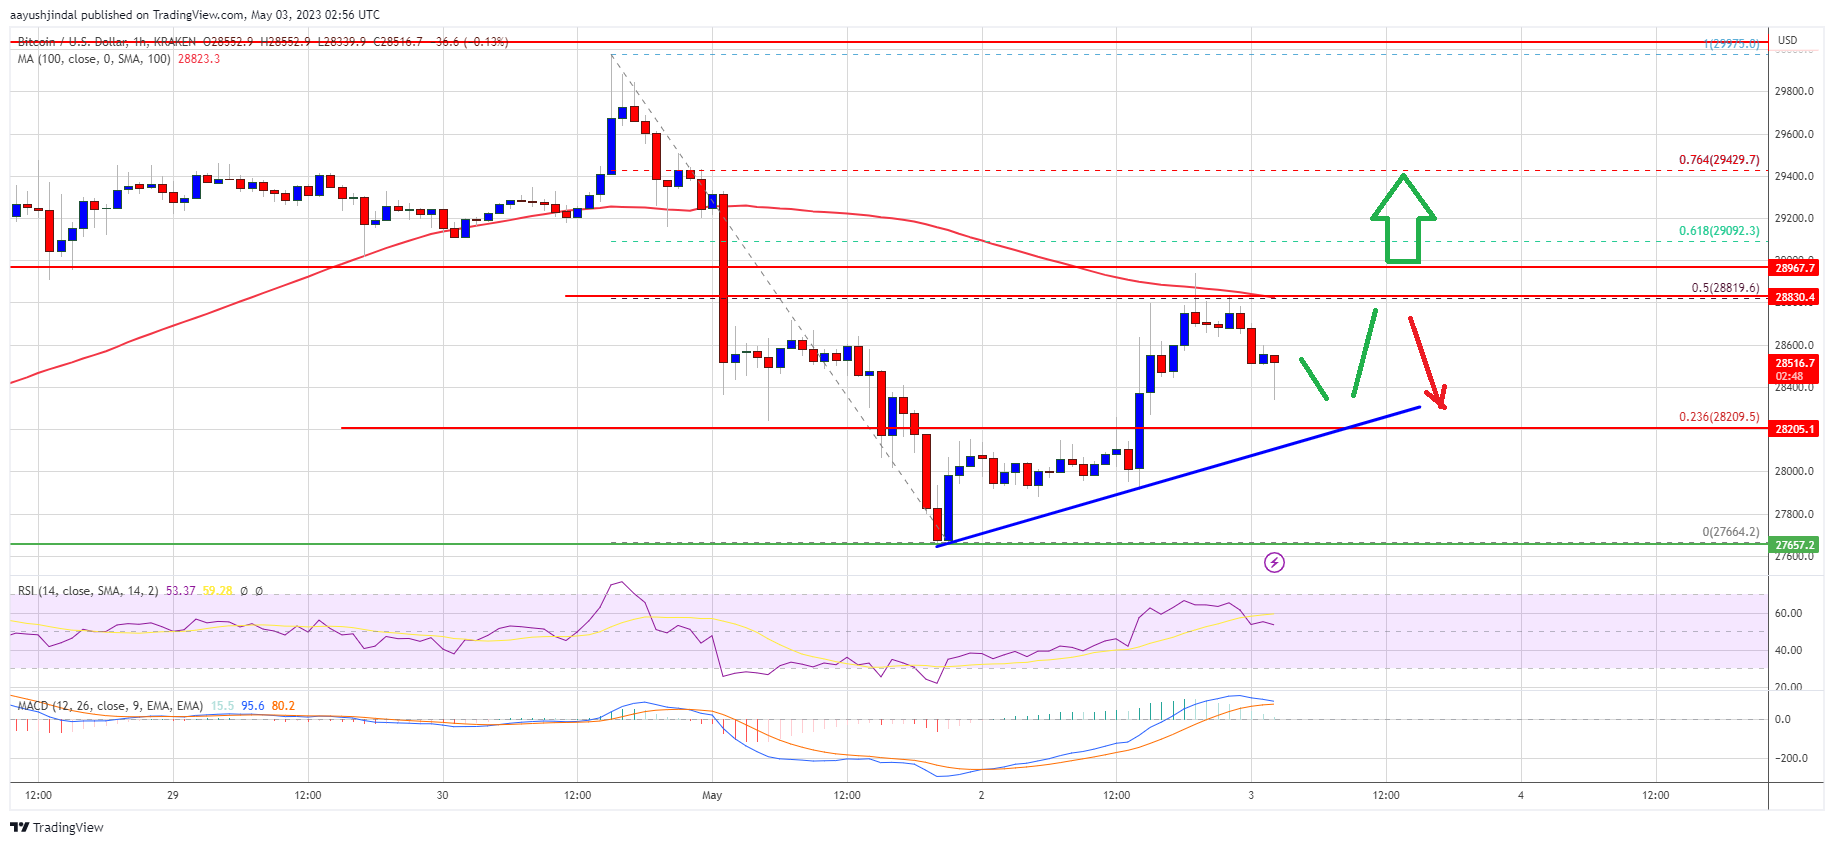
There was a move above the 23.6% Fib retracement level of the key drop from the $29,975 swing high to the $27,665 low. However, the bulls faced a strong resistance near the $28,800 zone and the 100 hourly Simple moving average.
Bitcoin price was rejected near the 50% Fib retracement level of the key drop from the $29,975 swing high to the $27,665 low. It is now trading below $28,800 and the 100 hourly Simple moving average.
Besides, there is a connecting bullish trend line forming with support near $28,200 on the hourly chart of the BTC/USD pair. Immediate resistance is near the $28,800 level. The next major resistance sits near the $29,000 zone and the $29,080 level.
Source: BTCUSD on TradingView.com
A close above the $29,000 resistance could send Bitcoin further higher. In the stated case, the price may perhaps rise toward the $29,500 level. Any more gains could open the doors for a test of the key barrier at $30,000.
Another Drop in BTC?
If Bitcoin’s price fails to clear the $28,800 resistance, it could start another decline. Immediate support on the downside is near the $28,200 level and the trend line.
The next major support is near the $27,660 zone or the recent swing low, below which the price might drop toward the $27,200 support zone. Any more losses might take Bitcoin toward $26,500 in the near term.
Technical indicators:
Hourly MACD – The MACD is now losing pace in the bullish zone.
Hourly RSI (Relative Strength Index) – The RSI for BTC/USD is now above the 50 level.
Major Support Levels – $28,200, followed by $27,660.
Major Resistance Levels – $28,800, $29,000, and $29,500.
[#item_full_content]NewsBTCRead More


Recent Posts
Strategy CEO Phong Le Reveals How MSTR Is Rewriting Corporate Finance In New Bitcoin Presentation
Bitcoin Magazine Strategy CEO Phong Le Reveals How MSTR Is Rewriting Corporate Finance In New…
Fidelity’s Chris Kuiper Presents “The Investment Case For Bitcoin” At Corporate Conference
Bitcoin Magazine Fidelity’s Chris Kuiper Presents “The Investment Case For Bitcoin” At Corporate Conference Speaking…
Strive Asset Management to Go Public, Launch Bitcoin Treasury Strategy With Merger
Shares of tech company Asset Entities (ASST) rose 194% on Wednesday after it announced that…
Michael Saylor Delivers Bitcoin for Corporations 2025 Keynote Speech
Bitcoin Magazine Michael Saylor Delivers Bitcoin for Corporations 2025 Keynote Speech In his keynote at…
The Market Reaction to Trump’s Tariffs Signals a Broader Acceptance of Bitcoin’s ‘Digital Gold’ Narrative
In financial markets, making assumptions based on short-term observations is a fool’s errand, as significant…
Bitcoin Payments App Strike to Offer BTC Lending in Boost to Reemergent Sector
Jack Mallers' bitcoin (BTC) payments app Strike is set to move into the BTC lending…