Bitcoin Price Faces Potential Dive: Key Support Levels to Monitor
Bitcoin price failed to recover above the $62,500 resistance zone. BTC is showing bearish signs and might decline again below the $60,000 support.
Bitcoin struggled to recover above the $62,200 and $62,500 levels.
The price is trading below $62,000 and the 100 hourly Simple moving average.
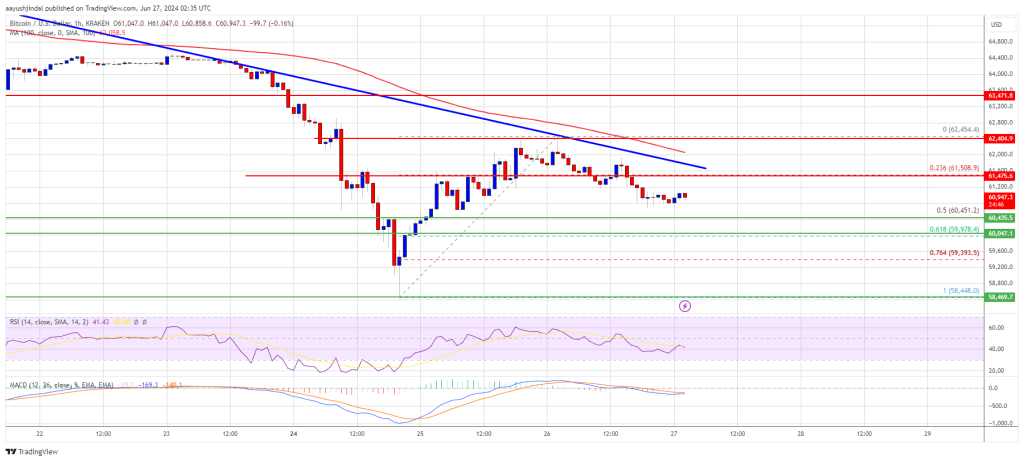
There is a major bearish trend line forming with resistance at $61,850 on the hourly chart of the BTC/USD pair (data feed from Kraken).
The pair might start another decline unless there is a close above the $62,000 resistance zone.
Bitcoin Price Remains At Risk
Bitcoin price started a recovery wave above the $61,200 zone. BTC even attempted a move above the $62,000 resistance zone. However, the bears were active near the $62,500 zone.
A high was formed at $62,454 and the price is now moving lower. There was a move below the $61,500 level. The price declined below the 23.6% Fib retracement level of the upward move from the $58,448 swing low to the $62,454 high.
Bitcoin price is trading below $62,000 and the 100 hourly Simple moving average. There is also a major bearish trend line forming with resistance at $61,850 on the hourly chart of the BTC/USD pair.
The price is now stable above the 50% Fib retracement level of the upward move from the $58,448 swing low to the $62,454 high. If there is another increase, the price could face resistance near the $61,500 level. The first key resistance is near the $61,850 level and the trend line.
The next key resistance could be $62,000. A clear move above the $62,000 resistance might start a steady increase and send the price higher. In the stated case, the price could rise and test the $62,500 resistance. Any more gains might send BTC toward the $63,500 resistance in the near term.
More Losses In BTC?
If Bitcoin fails to climb above the $62,000 resistance zone, it could start another decline. Immediate support on the downside is near the $60,450 level.
The first major support is $60,000. The next support is now forming near $59,500. Any more losses might send the price toward the $58,500 support zone in the near term.
Technical indicators:
Hourly MACD – The MACD is now gaining pace in the bearish zone.
Hourly RSI (Relative Strength Index) – The RSI for BTC/USD is now below the 50 level.
Major Support Levels – $60,500, followed by $60,000.
Major Resistance Levels – $62,000, and $62,500.
[#item_full_content]NewsBTCRead More


Recent Posts
Bitcoin Rally Short-Circuited as Fed Chair Powell Raises Stagflation Fear
A modest bitcoin rally to a possible challenge of the $86,000 level quickly reversed during…
Bitcoin Price Following Analyst’s Prediction For Bullish Breakout, Here’s The Target
The Bitcoin price appears to be moving in lockstep with a bullish prediction made by…
Panama City Approves Bitcoin and Crypto Payments for Taxes, Fees, and Permits
Bitcoin Magazine Panama City Approves Bitcoin and Crypto Payments for Taxes, Fees, and Permits In…
How Expanding Global Liquidity Could Drive Bitcoin Price to New All-Time Highs
Bitcoin Magazine How Expanding Global Liquidity Could Drive Bitcoin Price to New All-Time Highs Bitcoin’s…
bitcoin++ mempools and mining edition: The Premier Developer-Centric Bitcoin Event Returns to Austin
Bitcoin Magazine bitcoin++ mempools and mining edition: The Premier Developer-Centric Bitcoin Event Returns to Austin…
Bull Bitcoin Expands to Mexico, Enabling Global Bitcoin Payments to Mexican Accounts
Bitcoin Magazine Bull Bitcoin Expands to Mexico, Enabling Global Bitcoin Payments to Mexican Accounts Bull…