Bitcoin price is gaining pace above $20,000 against the US Dollar. BTC is showing positive signs and might rise further towards $22,000 or even $25,000.
Bitcoin is gaining pace above the $20,000 and $20,500 resistance levels.
The price is trading above $20,000 and the 100 hourly simple moving average.
There is a major contracting triangle forming with resistance near $20,820 on the hourly chart of the BTC/USD pair (data feed from Kraken).
The pair could rally again if there is a clear move above the $21,200 resistance.
Bitcoin price started a fresh increase above the $19,650 and $20,000 resistance levels. BTC bulls were able to push the price into a positive zone above the $20,200 level.
Yesterday, we saw a bullish continuation pattern with resistance at $20,300. The price did move higher and cleared the $20,300 resistance. It even cleared the $20,500 resistance and settled well above the 100 hourly simple moving average.
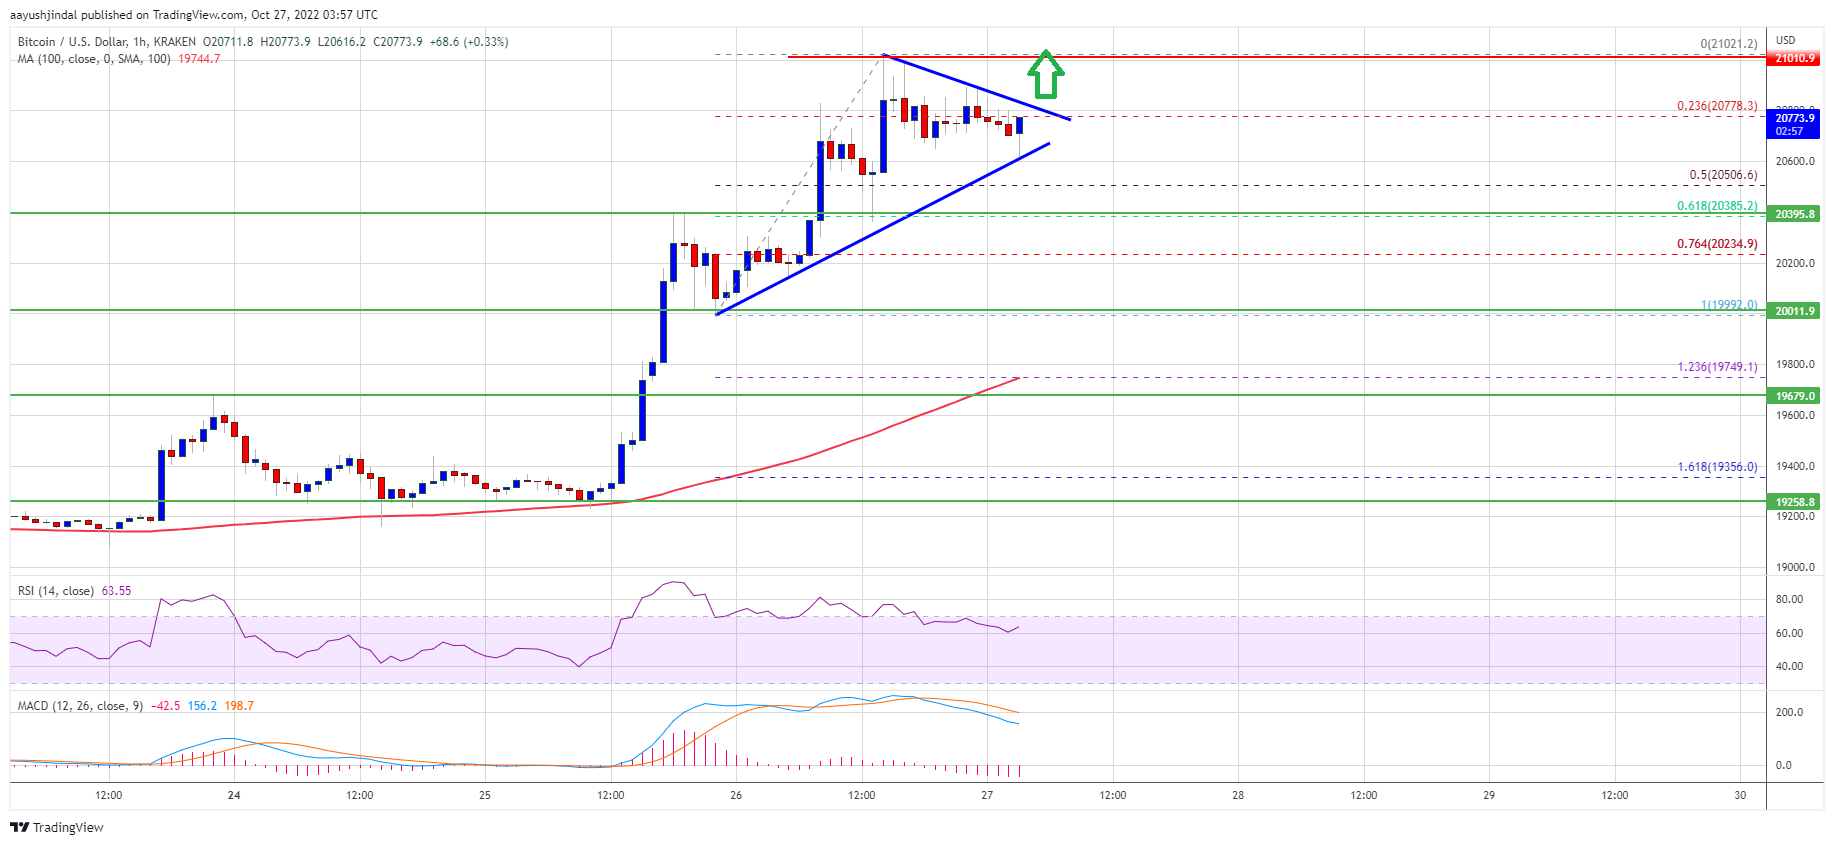
A high was formed near $21,021 and the price is now consolidating gains. There was a minor decline below the $20,800 level. Bitcoin price dipped below the 23.6% Fib retracement level of the upward move from the $19,992 swing low to $21,021 high.
It is now trading above $20,000 and the 100 hourly simple moving average. There is also a major contracting triangle forming with resistance near $20,820 on the hourly chart of the BTC/USD pair.
Source: BTCUSD on TradingView.com
On the upside, an immediate resistance is near the $20,800 zone. The first major resistance sits near the $21,000 level. The next major resistance might be $21,200. A clear move above the $21,200 resistance might send the price towards the $22,000 resistance. Any more gains open the doors for a steady increase towards the $25,000 resistance zone.
If bitcoin fails to rise above the $21,200 resistance zone, it could start a downside correction. An immediate support on the downside is near the $20,700 zone.
The next major support is near the $20,500 zone. It is near the 50% Fib retracement level of the upward move from the $19,992 swing low to $21,021 high. A downside break and close below $20,500 might clear the path for a test of the $20,000 zone.
Technical indicators:
Hourly MACD – The MACD is now gaining pace in the bullish zone.
Hourly RSI (Relative Strength Index) – The RSI for BTC/USD is now well above the 50 level.
Major Support Levels – $20,700, followed by $20,500.
Major Resistance Levels – $20,820, $21,200 and $22,000.
Bitcoin price is gaining pace above $20,000 against the US Dollar. BTC is showing positive signs and might rise further towards $22,000 or even $25,000.
Bitcoin is gaining pace above the $20,000 and $20,500 resistance levels.
The price is trading above $20,000 and the 100 hourly simple moving average.
There is a major contracting triangle forming with resistance near $20,820 on the hourly chart of the BTC/USD pair (data feed from Kraken).
The pair could rally again if there is a clear move above the $21,200 resistance.
Bitcoin price started a fresh increase above the $19,650 and $20,000 resistance levels. BTC bulls were able to push the price into a positive zone above the $20,200 level.
Yesterday, we saw a bullish continuation pattern with resistance at $20,300. The price did move higher and cleared the $20,300 resistance. It even cleared the $20,500 resistance and settled well above the 100 hourly simple moving average.
A high was formed near $21,021 and the price is now consolidating gains. There was a minor decline below the $20,800 level. Bitcoin price dipped below the 23.6% Fib retracement level of the upward move from the $19,992 swing low to $21,021 high.
It is now trading above $20,000 and the 100 hourly simple moving average. There is also a major contracting triangle forming with resistance near $20,820 on the hourly chart of the BTC/USD pair.
Source: BTCUSD on TradingView.com
On the upside, an immediate resistance is near the $20,800 zone. The first major resistance sits near the $21,000 level. The next major resistance might be $21,200. A clear move above the $21,200 resistance might send the price towards the $22,000 resistance. Any more gains open the doors for a steady increase towards the $25,000 resistance zone.
If bitcoin fails to rise above the $21,200 resistance zone, it could start a downside correction. An immediate support on the downside is near the $20,700 zone.
The next major support is near the $20,500 zone. It is near the 50% Fib retracement level of the upward move from the $19,992 swing low to $21,021 high. A downside break and close below $20,500 might clear the path for a test of the $20,000 zone.
Technical indicators:
Hourly MACD – The MACD is now gaining pace in the bullish zone.
Hourly RSI (Relative Strength Index) – The RSI for BTC/USD is now well above the 50 level.
Major Support Levels – $20,700, followed by $20,500.
Major Resistance Levels – $20,820, $21,200 and $22,000.
Tags: bitcoinbtcusdBTCUSDTxbtusd
NewsBTCRead More
In his testimony on Tuesday, Federal Reserve Chair Jerome Powell dampened hopes for another round…
Bitcoin banks are going to happen. We already have a few of them. We’re going…
There have been recent concerns within the crypto community regarding Binance’s recent activities after a…
By launching its Macro Strategic Reserve, World Liberty Financial (WLFI) has advanced significantly and strengthened…
Bitcoin (BTC) continues to move within its one-week range after recovering from its recent drop…
Alexander Vinnik, the jailed former operator of once mighty bitcoin exchange BTC-e, is being released…