Bitcoin price is still struggling to gain pace for a move above $35,000. BTC could correct a few points before the bulls attempt another increase.
Bitcoin is still struggling to clear the $35,000 resistance.
The price is trading above $34,150 and the 100 hourly Simple moving average.
There is a short-term rising channel forming with support near $34,280 on the hourly chart of the BTC/USD pair (data feed from Kraken).
The pair could correct lower toward the $34,000 zone before it attempts a fresh increase.
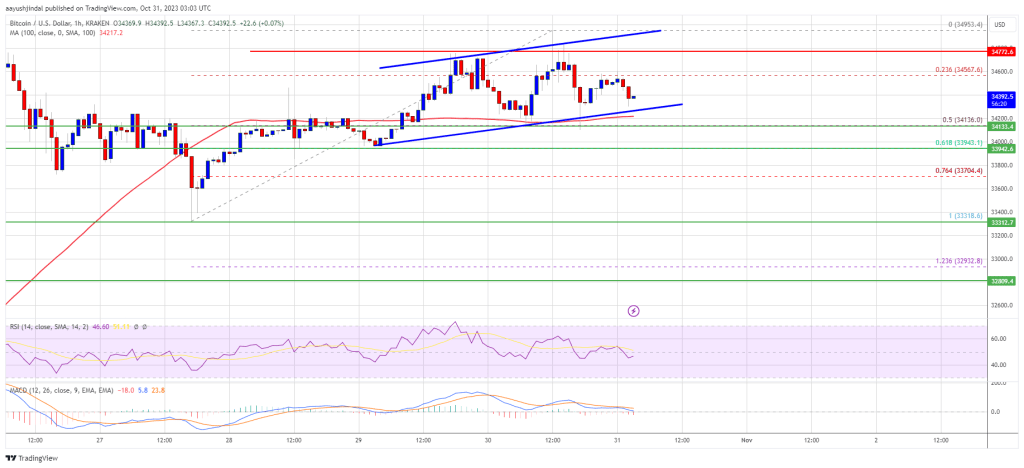
Bitcoin price remained strong above the $33,800 level. BTC formed a base and attempted another increase above the $34,500 resistance zone. It even spiked toward the main barrier at $35,000.
However, there was no upside continuation. The price formed a top near $34,953 and recently corrected lower. There was a move below the $34,600 level. The price declined below the 23.6% Fib retracement level of the upward move from the $33,319 swing low to the $34,953 high.
Bitcoin is now trading above $34,280 and the 100 hourly Simple moving average. There is also a short-term rising channel forming with support near $34,280 on the hourly chart of the BTC/USD pair.
On the upside, immediate resistance is near the $34,780 level. The next key resistance could be near $34,950 or the channel upper trend line. The main resistance is still near the $35,000 zone. A clear move above the $35,000 resistance might start a decent increase.
Source: BTCUSD on TradingView.com
The next key resistance could be $35,500, above which the price could test $36,200. Any more gains might send BTC toward the $36,500 level in the near term.
If Bitcoin fails to rise above the $34,750 resistance zone, it could start a downside correction. Immediate support on the downside is near the $34,250 level and the 100 hourly Simple moving average.
The next major support is near the $33,950 level or the 61.8% Fib retracement level of the upward move from the $33,319 swing low to the $34,953 high. If there is a move below $33,950, there is a risk of more downsides. In the stated case, the price could decline toward the $33,400 level or even $33,200.
Technical indicators:
Hourly MACD – The MACD is now gaining pace in the bearish zone.
Hourly RSI (Relative Strength Index) – The RSI for BTC/USD is now below the 50 level.
Major Support Levels – $34,280, followed by $33,950.
Major Resistance Levels – $34,750, $34,950, and $35,000.
[#item_full_content]NewsBTCRead MoreBitcoin banks are going to happen. We already have a few of them. We’re going…
There have been recent concerns within the crypto community regarding Binance’s recent activities after a…
By launching its Macro Strategic Reserve, World Liberty Financial (WLFI) has advanced significantly and strengthened…
Bitcoin (BTC) continues to move within its one-week range after recovering from its recent drop…
Alexander Vinnik, the jailed former operator of once mighty bitcoin exchange BTC-e, is being released…
Founder: Nicolas Burtey Date Founded: September 2019 Location of Headquarters: United States Number of Employees:…