Bitcoin price gained pace above the $17,500 resistance after the US CPI release. BTC tested the $18,000 resistance and might correct lower in the short-term.
Bitcoin was able to clear the $17,450 and $17,500 resistance levels.
The price is trading above $17,500 and the 100 hourly simple moving average.
There was a break above a key contracting triangle with resistance near $17,240 on the hourly chart of the BTC/USD pair (data feed from Kraken).
The pair could correct lower, but dips might be limited below the $17,500 support zone.
Bitcoin price remained strong above the $16,800 support zone. BTC formed a base and started a fresh increase above the $17,000 resistance zone and the 100 hourly simple moving average.
The price gained bullish momentum after the US CPI release (+7.1%) and rallied above the $17,500 resistance zone. There was a break above a key contracting triangle with resistance near $17,240 on the hourly chart of the BTC/USD pair.
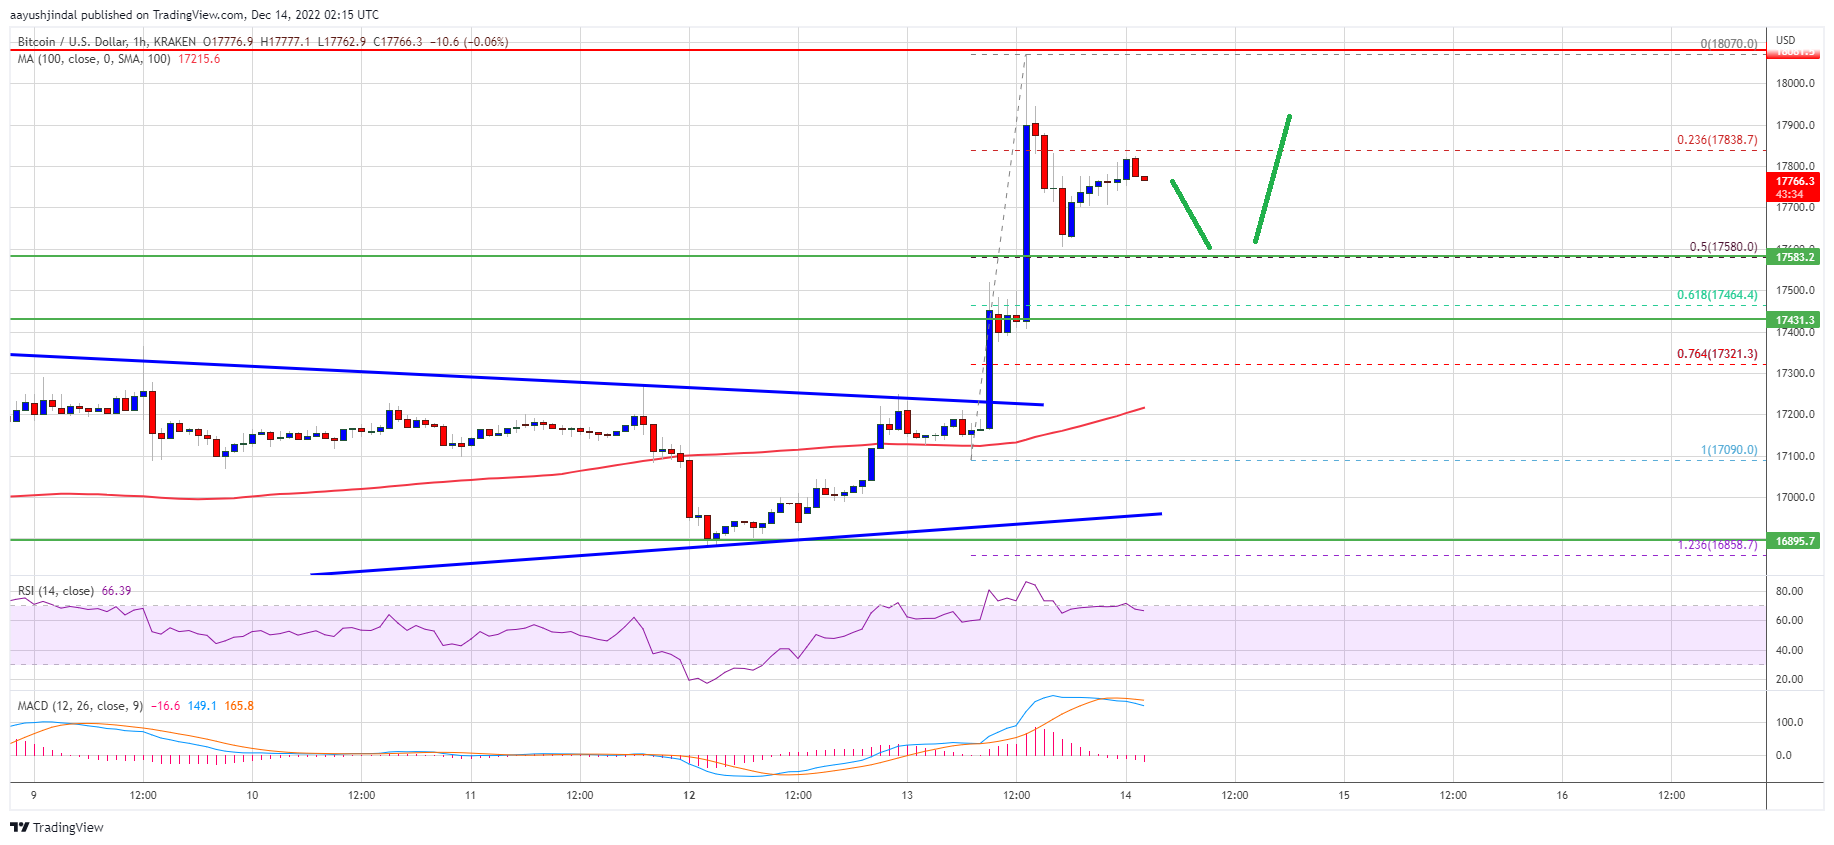
Bitcoin price is now trading above $17,500 and the 100 hourly simple moving average. A high was formed near $18,070 and the price is now correcting gains. It traded below the 23.6% Fib retracement level of the recent rally from the $17,090 low to $18,070 high.
However, the bulls were active above the $17,500 support zone. It remained stable above the 50% Fib retracement level of the recent rally from the $17,090 low to $18,070 high.
On the upside, an immediate resistance is near the $17,850 level. The first major resistance is near the $18,000 zone, above which the price may perhaps rise towards the $18,250 zone.
Source: BTCUSD on TradingView.com
The next major resistance is near $18,500, above which the price start a steady increase and rise towards the $19,200 zone in the near term.
If bitcoin fails to clear the $17,850 resistance, there could be a downside correction. An immediate support on the downside is near the $17,580 level.
The next major support is near the $17,500 zone. A downside break below the $17,500 support might call a drop towards $17,200 or the 100 hourly simple moving average. Any more losses might push the price towards the $17,000 zone in the near term.
Technical indicators:
Hourly MACD – The MACD is now losing pace in the bullish zone.
Hourly RSI (Relative Strength Index) – The RSI for BTC/USD is now above the 50 level.
Major Support Levels – $17,500, followed by $17,200.
Major Resistance Levels – $17,850, $18,000 and $18,500.
Bitcoin price gained pace above the $17,500 resistance after the US CPI release. BTC tested the $18,000 resistance and might correct lower in the short-term.
Bitcoin was able to clear the $17,450 and $17,500 resistance levels.
The price is trading above $17,500 and the 100 hourly simple moving average.
There was a break above a key contracting triangle with resistance near $17,240 on the hourly chart of the BTC/USD pair (data feed from Kraken).
The pair could correct lower, but dips might be limited below the $17,500 support zone.
Bitcoin price remained strong above the $16,800 support zone. BTC formed a base and started a fresh increase above the $17,000 resistance zone and the 100 hourly simple moving average.
The price gained bullish momentum after the US CPI release (+7.1%) and rallied above the $17,500 resistance zone. There was a break above a key contracting triangle with resistance near $17,240 on the hourly chart of the BTC/USD pair.
Bitcoin price is now trading above $17,500 and the 100 hourly simple moving average. A high was formed near $18,070 and the price is now correcting gains. It traded below the 23.6% Fib retracement level of the recent rally from the $17,090 low to $18,070 high.
However, the bulls were active above the $17,500 support zone. It remained stable above the 50% Fib retracement level of the recent rally from the $17,090 low to $18,070 high.
On the upside, an immediate resistance is near the $17,850 level. The first major resistance is near the $18,000 zone, above which the price may perhaps rise towards the $18,250 zone.
Source: BTCUSD on TradingView.com
The next major resistance is near $18,500, above which the price start a steady increase and rise towards the $19,200 zone in the near term.
If bitcoin fails to clear the $17,850 resistance, there could be a downside correction. An immediate support on the downside is near the $17,580 level.
The next major support is near the $17,500 zone. A downside break below the $17,500 support might call a drop towards $17,200 or the 100 hourly simple moving average. Any more losses might push the price towards the $17,000 zone in the near term.
Technical indicators:
Hourly MACD – The MACD is now losing pace in the bullish zone.
Hourly RSI (Relative Strength Index) – The RSI for BTC/USD is now above the 50 level.
Major Support Levels – $17,500, followed by $17,200.
Major Resistance Levels – $17,850, $18,000 and $18,500.
Featured Image from iStock
Tags: bitcoinbitcoin pricebtcusdBTCUSDTxbtusd
NewsBTCRead More
Bitcoin Twitter (or Bitcoin X) is having a moment after a 13F filing by Goldman…
After a relatively subdued price performance in 2024, Ethereum (ETH) could be on the verge…
In El Salvador, about two hours away from the capital, up in the mountains, lies…
Bitcoin has experienced a challenging period recently, with its price consistently declining over the past…
U.S. inflation unexpectedly marched higher in January, sending crypto and traditional markets sharply lower. The…
World Liberty Financial (WLFI), a crypto project Trump has financial interests in, has launched a…