Bitcoin price is still above the $33,200 support zone. BTC could start a fresh increase unless there is a close below the 100 hourly SMA and $33,400.
Bitcoin is still struggling to clear the $35,000 resistance.
The price is trading above $33,500 and the 100 hourly Simple moving average.
There is a connecting bearish trend line forming with resistance near $34,120 on the hourly chart of the BTC/USD pair (data feed from Kraken).
The pair could start a fresh increase if it clears the trend line and then $34,555.
Bitcoin price failed to gain strength for a close above the $35,000 resistance zone. BTC started a fresh decline below the $34,500 level. There was a move below the $34,000 zone as well before the bulls appeared.
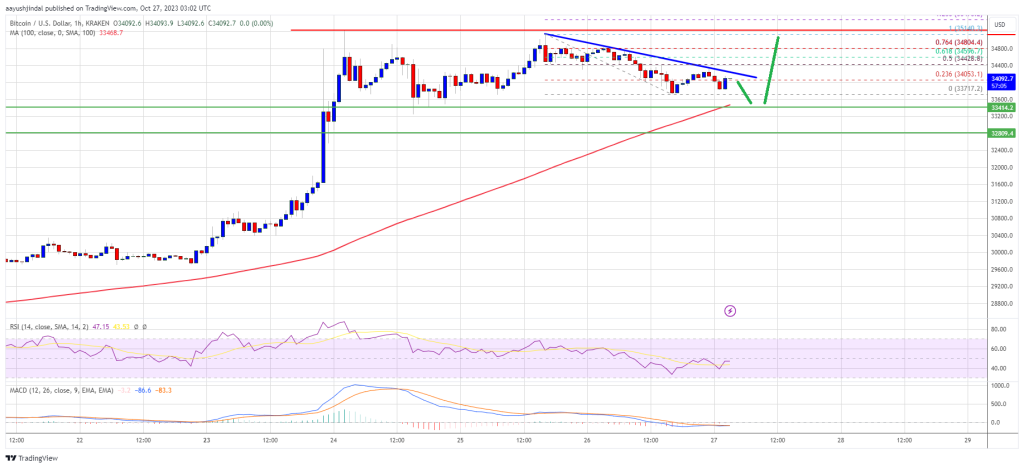
A low is formed near $33,717 and the price is still well above the 100 hourly Simple moving average. It is slowly moving higher above the $34,000 level. There was a break above the 23.6% Fib retracement level of the downward move from the $35,140 swing high to the $33,717 low.
Bitcoin is now trading above $33,650 and the 100 hourly Simple moving average. On the upside, immediate resistance is near the $34,100 level. There is also a connecting bearish trend line forming with resistance near $34,120 on the hourly chart of the BTC/USD pair.
The next key resistance could be near $34,550 or the 61.8% Fib retracement level of the downward move from the $35,140 swing high to the $33,717 low. The main resistance is still near the $35,000 zone.
Source: BTCUSD on TradingView.com
A clear move above the $35,000 resistance might start another surge. The next key resistance could be $36,500. Any more gains might send BTC toward the $38,000 level in the coming days.
If Bitcoin fails to rise above the $34,550 resistance zone, it could start another decline. Immediate support on the downside is near the $33,700 level.
The next major support is near the $33,400 level and the 100 hourly Simple moving average. If there is a move below the 100 hourly Simple moving average, there is a risk of more downsides. In the stated case, the price could decline toward the $31,500 level in the coming sessions.
Technical indicators:
Hourly MACD – The MACD is now losing pace in the bullish zone.
Hourly RSI (Relative Strength Index) – The RSI for BTC/USD is now below the 50 level.
Major Support Levels – $33,700, followed by $33,400.
Major Resistance Levels – $34,120, $34,550, and $35,000.
[#item_full_content]NewsBTCRead MoreBitcoin price started a fresh decline below the $90,000 support. BTC must stay above the…
Earlier this morning, Bitcoin (BTC) hit a yearly low of $86,888 amid a broader market…
Bitcoin (BTC), the market’s leading cryptocurrency, has officially entered a new downtrend phase following a…
On-chain data shows the number of Bitcoin loss addresses has shot up following the cryptocurrency’s…
Bitcoin Magazine The University of Austin (UATX) Partners with the Texas Bitcoin Foundation, Bitcoin Policy…
Bitcoin Magazine Voltage Aims To Bring Bitcoin’s Lightning Network To Every Business In The World…