Bitcoin Price Holds Strong At $27,200 But Can BTC Clear This Hurdle?
Bitcoin price failed to clear the $28,500 resistance and corrected lower. BTC retested the $27,250 support and is currently attempting a fresh increase.
Bitcoin is holding gains and still consolidating above the $27,250 zone.
The price is trading below $27,800 and the 100 hourly Simple moving average.
There is a key bearish trend line forming with resistance near $27,780 on the hourly chart of the BTC/USD pair (data feed from Kraken).
The pair could struggle to clear the $27,800 and $28,500 resistance levels in the near term.
Bitcoin Price Faces Key Hurdles
Bitcoin price started a decent increase above the $27,800 resistance. However, BTC failed to remain in a positive zone and revisit the $28,500 resistance zone.
There was a steady decline below the $28,000 level. The price declined below the $27,500 level, but the bulls were active above the $27,250 support zone. A low was formed near $27,275 and the price is now rising. There was a move above the $27,500 level.
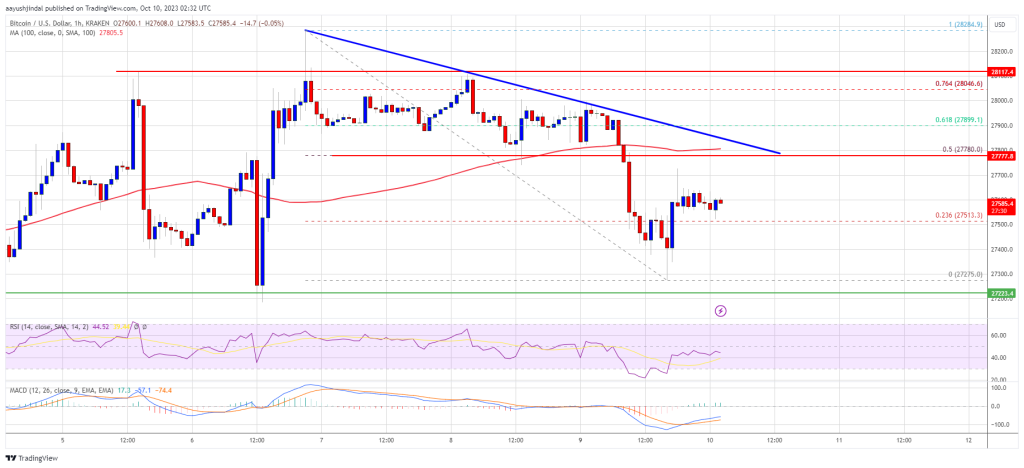
Bitcoin climbed above the 23.6% Fib retracement level of the recent decline from the $28,284 high to the $27,275 high. It is now trading below $27,800 and the 100 hourly Simple moving average.
Besides, there is a key bearish trend line forming with resistance near $27,780 on the hourly chart of the BTC/USD pair. Immediate resistance on the upside is near the $27,780 level and the trend line. It is close to the 50% Fib retracement level of the recent decline from the $28,284 high to the $27,275 high.
Source: BTCUSD on TradingView.com
The next key resistance could be near the $28,100 level. The first major resistance is $28,250, above which Bitcoin might test $28,500. A close above the $28,500 resistance could start another increase. In the stated case, the price could rise toward the $29,200 resistance. Any more gains might call for a move toward the $30,000 level.
Another Drop In BTC?
If Bitcoin fails to continue higher above the $27,780 resistance, there could be a fresh decline. Immediate support on the downside is near the $27,500 level.
The next major support is near the $27,250 level. A downside break and close below the $27,250 support might spark strong bearish moves. The next support sits at $26,200.
Technical indicators:
Hourly MACD – The MACD is now gaining pace in the bullish zone.
Hourly RSI (Relative Strength Index) – The RSI for BTC/USD is now above the 50 level.
Major Support Levels – $27,500, followed by $27,250.
Major Resistance Levels – $27,780, $28,250, and $28,500.
[#item_full_content]NewsBTCRead More


Recent Posts
Bitcoin $120K Target for 2Q May Be Too Conservative: Standard Chartered
Bitcoin (BTC) is poised to hit a new record high, with investment flows now the…
Sculpting Scarcity: Artist Maxfield Mellenbruch Brings Rare Steak Worth Millions To Bitcoin 2025
Bitcoin Magazine Sculpting Scarcity: Artist Maxfield Mellenbruch Brings Rare Steak Worth Millions To Bitcoin 2025 …
Bitcoin Tops $100K for First Time in 3 Months; Are Upside Targets Too Low?
Bitcoin is back in six figures, continuing yet another of its famous zigs when most…
Standard Chartered Analyst Apologizes For $120K Bitcoin Price Prediction, Says It Is Too Low
Bitcoin Magazine Standard Chartered Analyst Apologizes For $120K Bitcoin Price Prediction, Says It Is Too…
Coinbase To Acquire Bitcoin And Crypto Options Platform Deribit For $2.9B
Bitcoin Magazine Coinbase To Acquire Bitcoin And Crypto Options Platform Deribit For $2.9B Bitcoin and…
Breakout Alert: Ether, Bitcoin Cash-Bitcoin Ratio Break Downtrends as DOGE, SHIB Bottom Out
This is a daily technical analysis by CoinDesk analyst and Chartered Market Technician Omkar Godbole.…