Bitcoin price is moving higher above $19,250 against the US Dollar. BTC could eye a crucial upside break above the $19,500 and $19,650 resistance levels.
Bitcoin started a fresh increase above the $19,200 and $19,250 levels.
The price is trading above $19,200 and the 100 hourly simple moving average.
There was a break above a key bearish trend line with resistance near $19,200 on the hourly chart of the BTC/USD pair (data feed from Kraken).
The pair could start a strong increase if there is a clear move above the $19,650 resistance.
Bitcoin price remained well bid above the $18,800 level. BTC formed a base above the $19,000 level and started a fresh increase. There was a clear move above the $19,200 and $19,250 resistance levels.
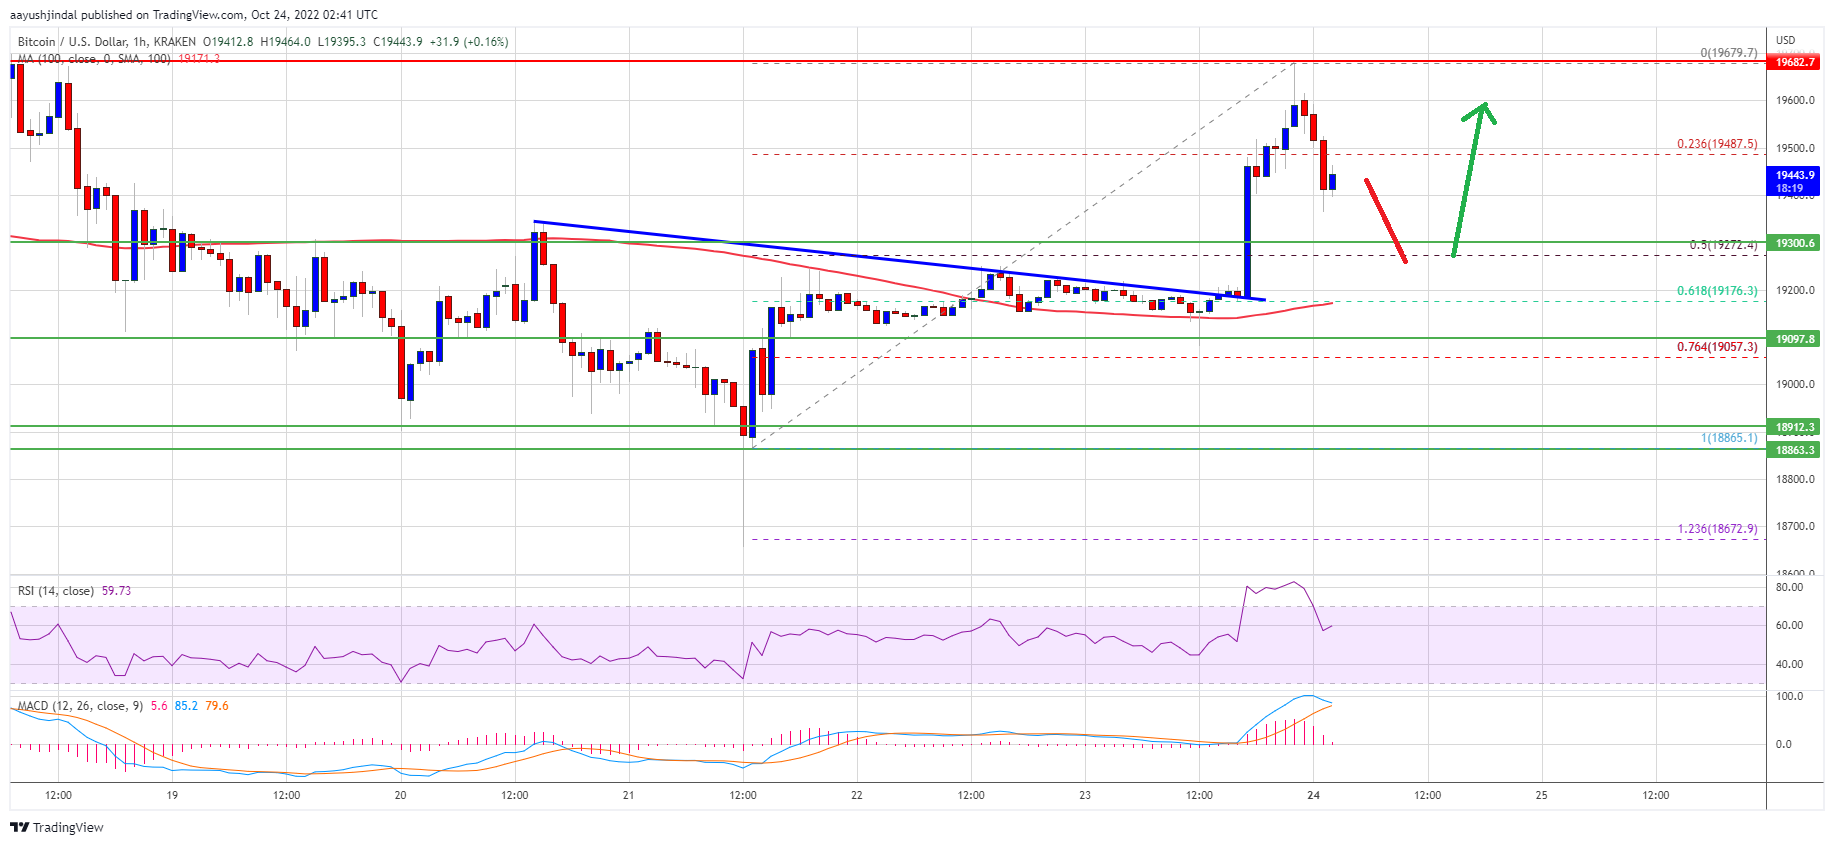
There was also a break above a key bearish trend line with resistance near $19,200 on the hourly chart of the BTC/USD pair. The pair gained pace above the $19,400 level and the 100 hourly simple moving average. It even broke the $19,500 resistance.
However, bitcoin price failed to gain momentum above the $19,600 zone. A high was formed near $19,679 and there was a minor downside correction.
The price is now trading below the 23.6% Fib retracement level of the upward move from the $18,865 swing low to $19,679 high. On the upside, an immediate resistance is near the $19,600 level. The first major resistance sits near the $19,650 level and the recent high.
Source: BTCUSD on TradingView.com
The next major resistance might be $20,000. A clear move above the $20,000 resistance might send the price towards the $20,500 resistance. Any more gains might open the doors for a move towards the $21,200 resistance zone.
If bitcoin fails to rise above the $19,600 resistance zone, it could continue to move down. An immediate support on the downside is near the $19,300 zone.
The next major support is near the $19,250 zone. It is close to the 50% Fib retracement level of the upward move from the $18,865 swing low to $19,679 high. A downside break and close below $19,250 might increase selling pressure and the price might revisit $18,800.
Technical indicators:
Hourly MACD – The MACD is now losing pace in the bullish zone.
Hourly RSI (Relative Strength Index) – The RSI for BTC/USD is now above the 50 level.
Major Support Levels – $19,300, followed by $19,250.
Major Resistance Levels – $19,500, $19,600 and $20,000.
Bitcoin price is moving higher above $19,250 against the US Dollar. BTC could eye a crucial upside break above the $19,500 and $19,650 resistance levels.
Bitcoin started a fresh increase above the $19,200 and $19,250 levels.
The price is trading above $19,200 and the 100 hourly simple moving average.
There was a break above a key bearish trend line with resistance near $19,200 on the hourly chart of the BTC/USD pair (data feed from Kraken).
The pair could start a strong increase if there is a clear move above the $19,650 resistance.
Bitcoin price remained well bid above the $18,800 level. BTC formed a base above the $19,000 level and started a fresh increase. There was a clear move above the $19,200 and $19,250 resistance levels.
There was also a break above a key bearish trend line with resistance near $19,200 on the hourly chart of the BTC/USD pair. The pair gained pace above the $19,400 level and the 100 hourly simple moving average. It even broke the $19,500 resistance.
However, bitcoin price failed to gain momentum above the $19,600 zone. A high was formed near $19,679 and there was a minor downside correction.
The price is now trading below the 23.6% Fib retracement level of the upward move from the $18,865 swing low to $19,679 high. On the upside, an immediate resistance is near the $19,600 level. The first major resistance sits near the $19,650 level and the recent high.
Source: BTCUSD on TradingView.com
The next major resistance might be $20,000. A clear move above the $20,000 resistance might send the price towards the $20,500 resistance. Any more gains might open the doors for a move towards the $21,200 resistance zone.
If bitcoin fails to rise above the $19,600 resistance zone, it could continue to move down. An immediate support on the downside is near the $19,300 zone.
The next major support is near the $19,250 zone. It is close to the 50% Fib retracement level of the upward move from the $18,865 swing low to $19,679 high. A downside break and close below $19,250 might increase selling pressure and the price might revisit $18,800.
Technical indicators:
Hourly MACD – The MACD is now losing pace in the bullish zone.
Hourly RSI (Relative Strength Index) – The RSI for BTC/USD is now above the 50 level.
Major Support Levels – $19,300, followed by $19,250.
Major Resistance Levels – $19,500, $19,600 and $20,000.
Tags: bitcoinbtcusdBTCUSDTxbtusd
NewsBTCRead More
Bitcoin Magazine The University of Austin (UATX) Partners with the Texas Bitcoin Foundation, Bitcoin Policy…
Bitcoin Magazine Voltage Aims To Bring Bitcoin’s Lightning Network To Every Business In The World…
Bitcoin Magazine How Local Businesses Can Use Bitcoin For Payments I. Introduction Bitcoin is often…
Bitcoin Magazine Bitcoin Price Set for Big Move as Volatility Drops Bitcoin appears to be…
Bitcoin Magazine FPPS Is Not A Free Lunch For Bitcoin Miners Bitcoin mining is a…
Bitcoin Magazine Conference Bitcoin Afrique: A Bitcoin-Only Revolution in French-Speaking Africa In April 2025, Bitcoiners…