Bitcoin price is slowly moving higher above $19,500 against the US Dollar. BTC could gain bullish momentum once it clears the $20,000 resistance zone.
Bitcoin remained well bid and started a decent increase above $19,500.
The price is trading above $19,400 and the 100 hourly simple moving average.
There was a break above a key bearish trend line with resistance near $19,240 on the hourly chart of the BTC/USD pair (data feed from Kraken).
The pair could start a strong increase if there is a close above the $20,000 resistance zone.
Bitcoin Price Eyes More Upsides
Bitcoin price formed a base above the $19,000 resistance zone. BTC remained stable and started a slow and steady increase above the $19,200 level.
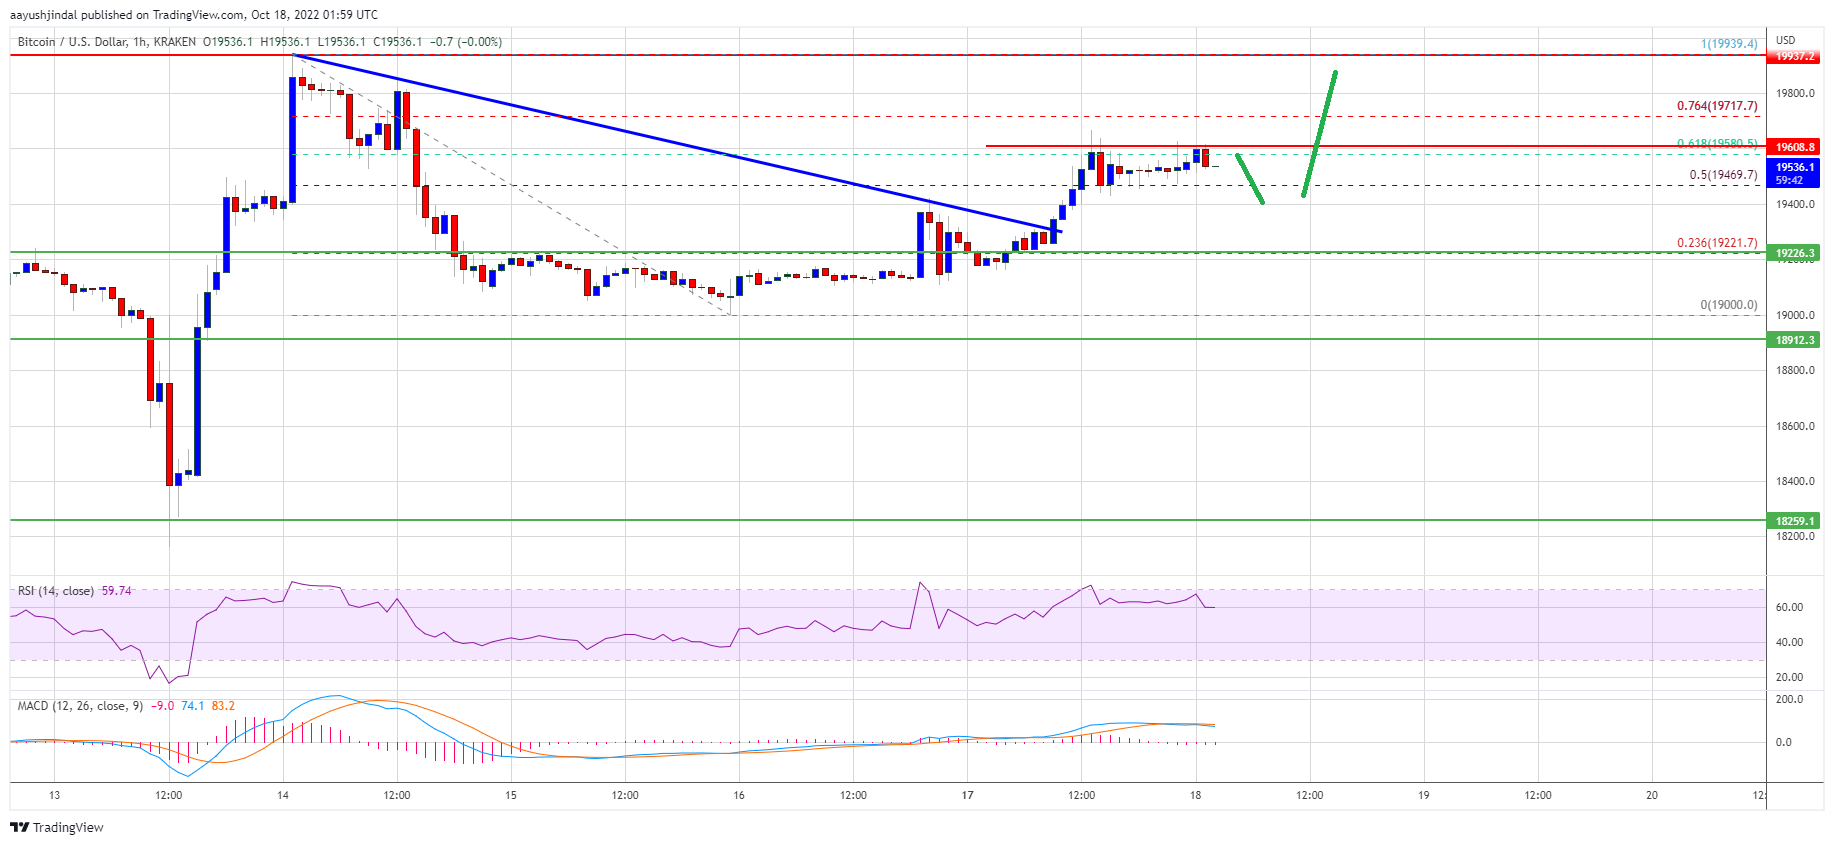
There was a break above a key bearish trend line with resistance near $19,240 on the hourly chart of the BTC/USD pair. The pair was able to clear the 50% Fib retracement level of the downward move from the $19,939 swing high to $19,000 low.
Bitcoin price is now trading above $19,400 and the 100 hourly simple moving average. On the upside, an immediate resistance is near the $19,600 level. It is close to the 61.8% Fib retracement level of the downward move from the $19,939 swing high to $19,000 low.
Source: BTCUSD on TradingView.com
The first major resistance sits near the $20,000 level. A clear move above the $20,000 resistance might pump the price in the near term. In the stated case, the price may perhaps test the $21,200 resistance. Any more gains might start a steady increase towards the $22,000 resistance zone.
Dips Supported in BTC?
If bitcoin fails to rise above the $20,000 resistance zone, it could start a downside correction. An immediate support on the downside is near the $19,200 zone and the 100 hourly simple moving average.
The next major support is near the $19,000 zone. A downside break and close below the $19,000 support zone might increase selling pressure. In the stated case, the price could decline towards the $18,500 support zone. Any more losses might send the price towards the $18,250 level.
Technical indicators:
Hourly MACD – The MACD is now losing pace in the bullish zone.
Hourly RSI (Relative Strength Index) – The RSI for BTC/USD is now above the 50 level.
Major Support Levels – $19,200, followed by $19,000.
Major Resistance Levels – $19,600, $20,000 and $21,200.
Bitcoin price is slowly moving higher above $19,500 against the US Dollar. BTC could gain bullish momentum once it clears the $20,000 resistance zone.
Bitcoin remained well bid and started a decent increase above $19,500.
The price is trading above $19,400 and the 100 hourly simple moving average.
There was a break above a key bearish trend line with resistance near $19,240 on the hourly chart of the BTC/USD pair (data feed from Kraken).
The pair could start a strong increase if there is a close above the $20,000 resistance zone.
Bitcoin price formed a base above the $19,000 resistance zone. BTC remained stable and started a slow and steady increase above the $19,200 level.
There was a break above a key bearish trend line with resistance near $19,240 on the hourly chart of the BTC/USD pair. The pair was able to clear the 50% Fib retracement level of the downward move from the $19,939 swing high to $19,000 low.
Bitcoin price is now trading above $19,400 and the 100 hourly simple moving average. On the upside, an immediate resistance is near the $19,600 level. It is close to the 61.8% Fib retracement level of the downward move from the $19,939 swing high to $19,000 low.
Source: BTCUSD on TradingView.com
The first major resistance sits near the $20,000 level. A clear move above the $20,000 resistance might pump the price in the near term. In the stated case, the price may perhaps test the $21,200 resistance. Any more gains might start a steady increase towards the $22,000 resistance zone.
If bitcoin fails to rise above the $20,000 resistance zone, it could start a downside correction. An immediate support on the downside is near the $19,200 zone and the 100 hourly simple moving average.
The next major support is near the $19,000 zone. A downside break and close below the $19,000 support zone might increase selling pressure. In the stated case, the price could decline towards the $18,500 support zone. Any more losses might send the price towards the $18,250 level.
Technical indicators:
Hourly MACD – The MACD is now losing pace in the bullish zone.
Hourly RSI (Relative Strength Index) – The RSI for BTC/USD is now above the 50 level.
Major Support Levels – $19,200, followed by $19,000.
Major Resistance Levels – $19,600, $20,000 and $21,200.
Tags: bitcoinbtcusdBTCUSDTxbtusd
NewsBTCRead More
Bitcoin price is struggling to clear the $100,000 resistance zone. BTC is again moving lower…
The price of Bitcoin (BTC) has shown only sideways movement in the last day resulting…
A sluggish Bitcoin price performance has not been the only disappointing theme for the largest…
World Liberty Financial, Trump’s crypto company, is making moves again. It recently bought another $1.4M…
Disclaimer: The analyst who wrote this piece owns shares of Strategy (MSTR) Strategy (MSTR) could…
Peter Brandt, a seasoned trader, has dismissed optimistic predictions in the wake of Bitcoin’s recent…