Bitcoin price spiked toward $30,000 after fake news about spot ETF hit the market. BTC is now consolidating above $28,200 and could rise toward $29,200.
Bitcoin is holding gains above the $28,000 and $28,200 levels.
The price is trading above $28,200 and the 100 hourly Simple moving average.
There is a key bullish trend line forming with support near $28,000 on the hourly chart of the BTC/USD pair (data feed from Kraken).
The pair could start a fresh increase if there is a clear move above the $28,800 resistance.
Bitcoin price started a strong increase above the $27,500 resistance zone. BTC saw a wild increase after fake news about the spot ETF approval hit the market.
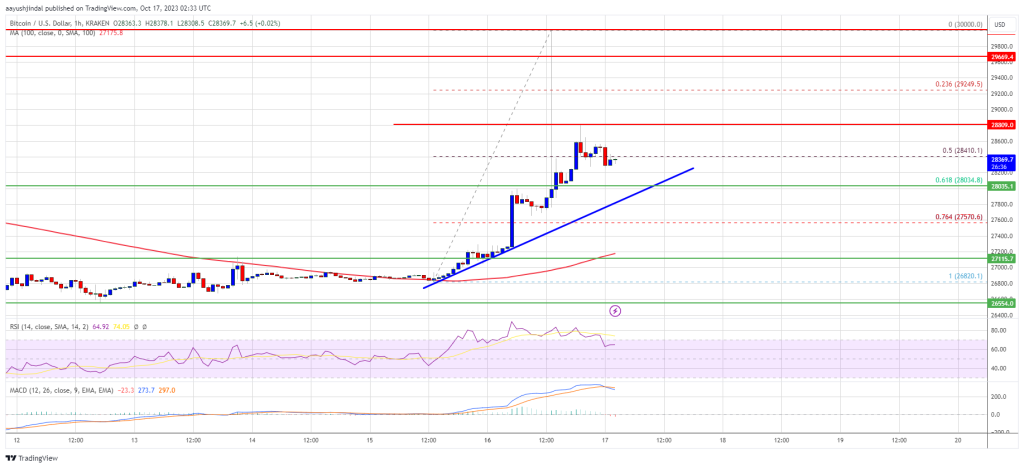
There was a nasty increase above the $28,500 resistance. The price even spiked toward $30,000 before trimming gains. There was a drop below the $29,200 and $28,800 support levels. The price even declined below the 50% Fib retracement level of the upward move from the $26,820 swing low to the $30,000 high.
Bitcoin price is now trading above $28,200 and the 100 hourly Simple moving average. There is also a key bullish trend line forming with support near $28,000 on the hourly chart of the BTC/USD pair. The trend line is near the 61.8% Fib retracement level of the upward move from the $26,820 swing low to the $30,000 high.
On the upside, immediate resistance is near the $28,600 level. The next key resistance could be near $28,800. A clear move above the $28,600 and $28,800 resistance levels could set the pace for a larger increase. The next key resistance could be $29,200.
Source: BTCUSD on TradingView.com
A close above the $29,200 resistance might start a steady increase toward the $29,500 level. Any more gains might send BTC toward the $30,000 level.
If Bitcoin fails to rise above the $28,800 resistance zone, it could slide further. Immediate support on the downside is near the $28,000 level and the trend line zone.
The next major support is near the $27,800 level. A downside break and close below the $27,800 support might send the price further lower. The next support sits at $27,200 and the 100 hourly Simple moving average.
Technical indicators:
Hourly MACD – The MACD is now gaining pace in the bullish zone.
Hourly RSI (Relative Strength Index) – The RSI for BTC/USD is now above the 50 level.
Major Support Levels – $28,000, followed by $27,800.
Major Resistance Levels – $28,600, $28,800, and $29,200.
[#item_full_content]NewsBTCRead MoreA sluggish Bitcoin price performance has not been the only disappointing theme for the largest…
World Liberty Financial, Trump’s crypto company, is making moves again. It recently bought another $1.4M…
Disclaimer: The analyst who wrote this piece owns shares of Strategy (MSTR) Strategy (MSTR) could…
Peter Brandt, a seasoned trader, has dismissed optimistic predictions in the wake of Bitcoin’s recent…
This article is part of a four-piece series on El Salvador. You can find the…
It was another volatile trading week in the Bitcoin (BTC) market marked by almost equal…