Bitcoin price is holding gains above $37,000. BTC is consolidating and might soon aim for another rally if it clears the $38,000 resistance zone.
Bitcoin is still consolidating below the $37,750 resistance.
The price is trading above $37,200 and the 100 hourly Simple moving average.
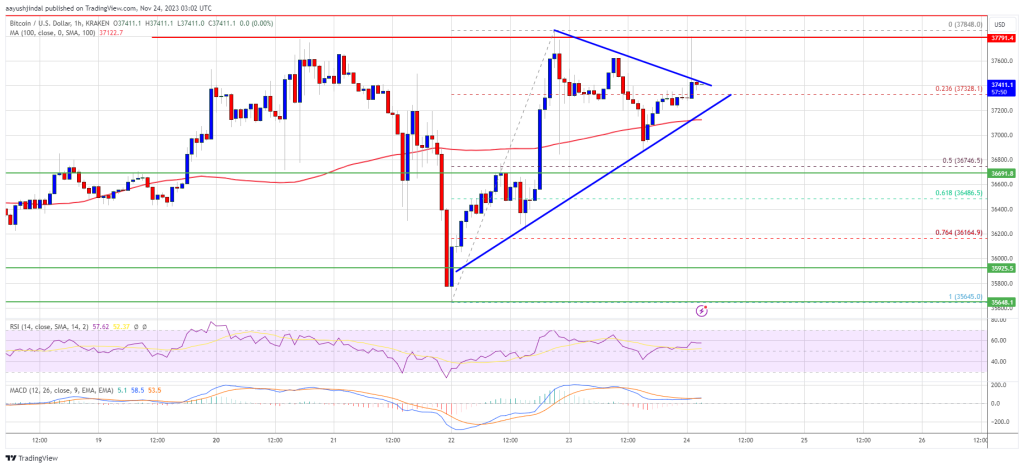
There is a short-term contracting triangle forming with resistance near $37,420 on the hourly chart of the BTC/USD pair (data feed from Kraken).
The pair could start a strong increase if it clears the $38,000 resistance zone.
Bitcoin price remained well-bid and started a steady increase above the $37,000 resistance. BTC trimmed all losses and even revisited the $37,750 resistance zone. It seems like the bulls are still struggling to clear the $37,750 resistance zone.
A high was formed near $37,848 and the price is now consolidating gains. There was a move below the 23.6% Fib retracement level of the upward move from the $35,645 swing low to the $37,848 high.
Bitcoin is now trading above $37,200 and the 100 hourly Simple moving average. There is also a short-term contracting triangle forming with resistance near $37,420 on the hourly chart of the BTC/USD pair. On the upside, immediate resistance is near the $37,420 level.
The first major resistance is forming near $37,750. The main resistance is still near the $38,000 level. A close above the $38,0000 resistance might start a strong increase.
Source: BTCUSD on TradingView.com
The next key resistance could be near $38,800, above which BTC could rise and test the $39,200 level. In the stated case, it could even rally toward the $40,000 resistance.
If Bitcoin fails to rise above the $37,750 resistance zone, it could start a fresh decline. Immediate support on the downside is near the $37,200 level.
The next major support is $37,000 and the 100 hourly Simple moving average. The first key support is at $36,750 or the 50% Fib retracement level of the upward move from the $35,645 swing low to the $37,848 high. If there is a move below $36,750, there is a risk of more downsides. In the stated case, the price could drop toward the $36,000 support in the near term. The next key support or target could be $35,650.
Technical indicators:
Hourly MACD – The MACD is now losing pace in the bullish zone.
Hourly RSI (Relative Strength Index) – The RSI for BTC/USD is now above the 50 level.
Major Support Levels – $37,000, followed by $36,750.
Major Resistance Levels – $37,750, $38,000, and $38,800.
[#item_full_content]NewsBTCRead MoreThe Bitcoin price action this weekend has been quite bubbly and impressive, with the premier…
Bitcoin (BTC) proponent Michael Saylor has hinted the company he co-founded, Strategy (MSTR), may be…
The price of Bitcoin has found its way back above the $85,000 mark, marking a…
Bitcoin has broken out of a technical formation that may place it on track toward…
Prominent X market analyst Cryptododo7 has shared a bearish prediction on the Bitcoin market amidst…
Technical expert Tony Severino has warned that the Bitcoin/VIX is not as bullish as market…