Bitcoin Price Key Trend is Forming And BTC Could Soon Surge to $18K
Bitcoin price gained pace for a fresh move above $17,000. BTC is rising and might climb higher towards the $18,000 resistance zone.
Bitcoin started a fresh increase above $17,000 and $17,200 resistance levels.
The price is trading above $16,800 and the 100 hourly simple moving average.
There was a break above a major bearish trend line with resistance near $17,000 on the hourly chart of the BTC/USD pair (data feed from Kraken).
The pair seems to be eyeing a move towards the $17,650 resistance or even $18,000.
Bitcoin Price Restarts Increase
Bitcoin price found support near the $16,800 zone after a downside correction. BTC remained well bid and started a fresh increase above the $17,000 resistance zone.
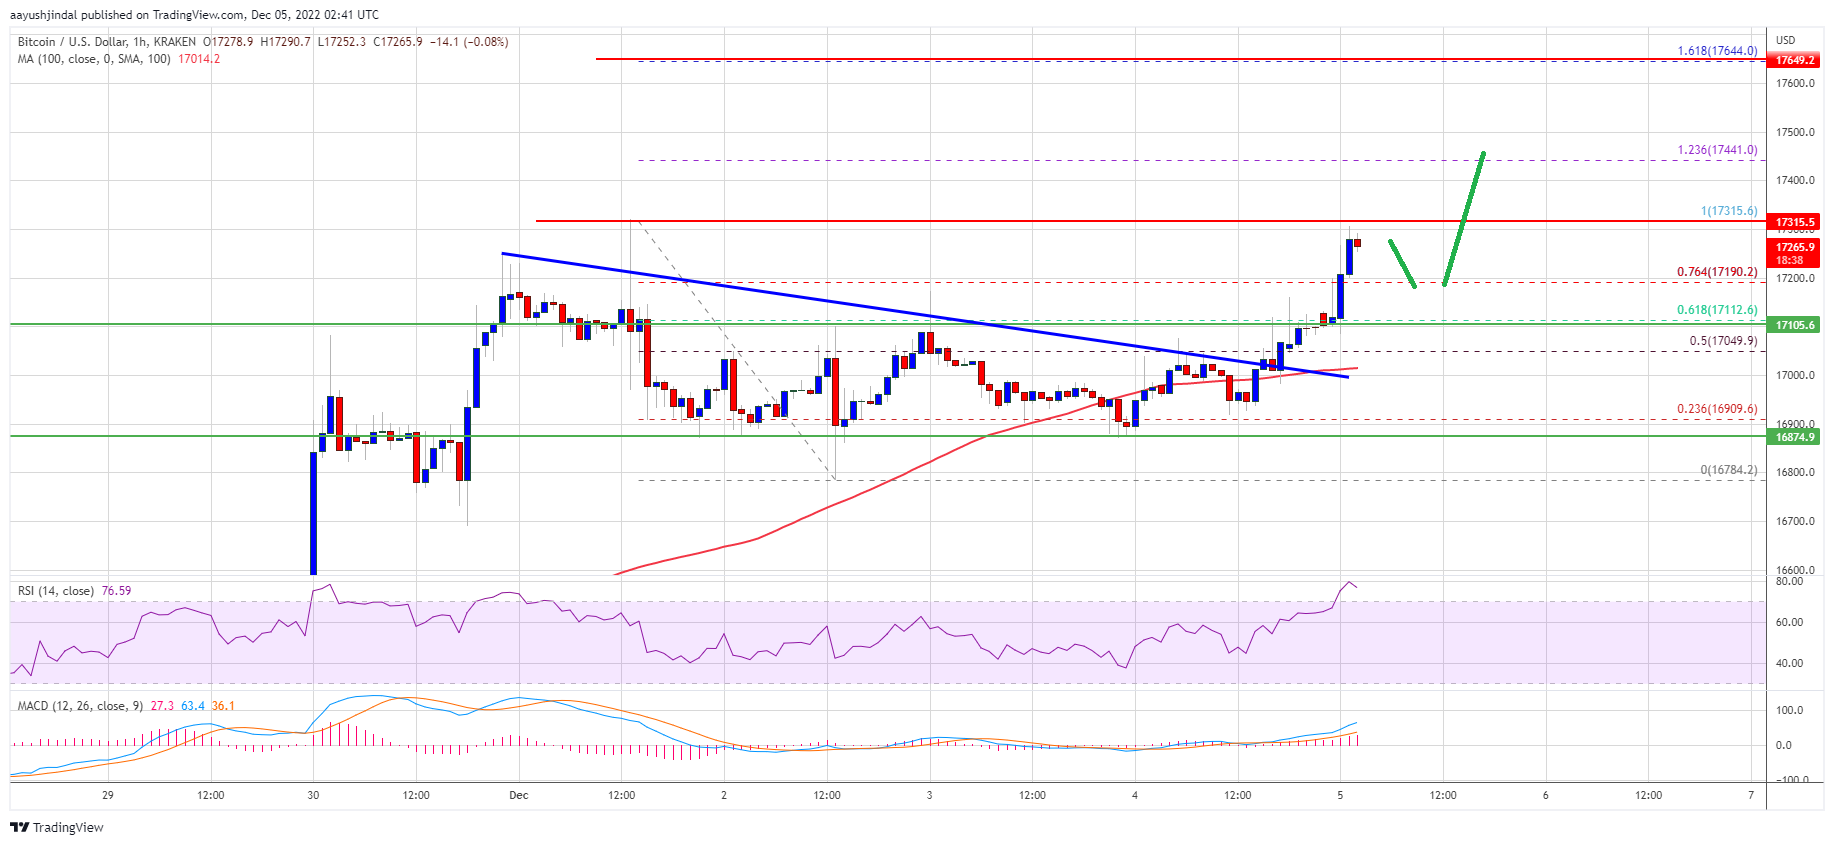
It even broke the $17,150 level and settled above the 100 hourly simple moving average. The price gained pace above the 76.4% Fib retracement level of the downward move from the $17,315 swing high to $16,784 swing low. Besides, there was a break above a major bearish trend line with resistance near $17,000 on the hourly chart of the BTC/USD pair.
Bitcoin price is now trading above $16,800 and the 100 hourly simple moving average. It is trading near the $17,250 level. On the upside, an immediate resistance is near the $17,350 level.
The first major resistance is near the $17,450 zone, above which the price may perhaps start another steady increase. In the stated case, the price could rise towards the $17,650 resistance. It is near the 1.618 Fib extension level of the downward move from the $17,315 swing high to $16,784 swing low.
Source: BTCUSD on TradingView.com
The next major resistance is near $18,000, above which the price could attempt a move towards the $18,500 zone in the near term.
Dips Limited in BTC?
If bitcoin fails to start a fresh increase above the $17,350 resistance, there could be more downsides. An immediate support on the downside is near the $17,150 level.
The next major support is near the $17,000 zone and the 100 hourly simple moving average. A downside break below the $17,000 support might call for a move towards $16,750. Any more losses might call for a test of the key $16,500 support zone in the near term.
Technical indicators:
Hourly MACD – The MACD is now gaining pace in the bullish zone.
Hourly RSI (Relative Strength Index) – The RSI for BTC/USD is now in the overbought zone.
Major Support Levels – $17,150, followed by $17,000.
Major Resistance Levels – $17,350, $17,450 and $18,000.
Bitcoin price gained pace for a fresh move above $17,000. BTC is rising and might climb higher towards the $18,000 resistance zone.
Bitcoin started a fresh increase above $17,000 and $17,200 resistance levels.
The price is trading above $16,800 and the 100 hourly simple moving average.
There was a break above a major bearish trend line with resistance near $17,000 on the hourly chart of the BTC/USD pair (data feed from Kraken).
The pair seems to be eyeing a move towards the $17,650 resistance or even $18,000.
Bitcoin Price Restarts Increase
Bitcoin price found support near the $16,800 zone after a downside correction. BTC remained well bid and started a fresh increase above the $17,000 resistance zone.
It even broke the $17,150 level and settled above the 100 hourly simple moving average. The price gained pace above the 76.4% Fib retracement level of the downward move from the $17,315 swing high to $16,784 swing low. Besides, there was a break above a major bearish trend line with resistance near $17,000 on the hourly chart of the BTC/USD pair.
Bitcoin price is now trading above $16,800 and the 100 hourly simple moving average. It is trading near the $17,250 level. On the upside, an immediate resistance is near the $17,350 level.
The first major resistance is near the $17,450 zone, above which the price may perhaps start another steady increase. In the stated case, the price could rise towards the $17,650 resistance. It is near the 1.618 Fib extension level of the downward move from the $17,315 swing high to $16,784 swing low.
Source: BTCUSD on TradingView.com
The next major resistance is near $18,000, above which the price could attempt a move towards the $18,500 zone in the near term.
Dips Limited in BTC?
If bitcoin fails to start a fresh increase above the $17,350 resistance, there could be more downsides. An immediate support on the downside is near the $17,150 level.
The next major support is near the $17,000 zone and the 100 hourly simple moving average. A downside break below the $17,000 support might call for a move towards $16,750. Any more losses might call for a test of the key $16,500 support zone in the near term.
Technical indicators:
Hourly MACD – The MACD is now gaining pace in the bullish zone.
Hourly RSI (Relative Strength Index) – The RSI for BTC/USD is now in the overbought zone.
Major Support Levels – $17,150, followed by $17,000.
Major Resistance Levels – $17,350, $17,450 and $18,000.
Tags: bitcoinbitcoin pricebtcusdBTCUSDTxbtusd
NewsBTCRead More


Recent Posts
JD Vance Says “Bitcoin Finally Has a Champion in the White House”
Bitcoin Magazine JD Vance Says “Bitcoin Finally Has a Champion in the White House” In…
Bitcoin Platform Mezo Debuts Mainnet to Build Circular BTC Economy
Blockchain venture studio Thesis, which is backed by Pantera Capital and Hack VC, has debuted…
Human Rights Foundation Donates 800 Million Satoshis To 22 Worldwide Bitcoin And Freedom Projects
Bitcoin Magazine Human Rights Foundation Donates 800 Million Satoshis To 22 Worldwide Bitcoin And Freedom…
Bitcoin Pulls Back to $107K, but NYDIG Analysis Suggests Market Far From Overheated
Wednesday morning U.S. hours saw a modest acceleration in crypto's pullback from the recent big…
Bitcoin Hits New Heights: Analyst Predicts Next Peak By Late 2025
As Bitcoin (BTC) continues to capture investor enthusiasm, recently reaching a new all-time high of…
Crypto Daybook Americas: Bitcoin Dominance Tops 64% While Options Indicate Bullish Tilt
By James Van Straten (All times ET unless indicated otherwise) Since May 22, bitcoin (BTC)…