Bitcoin Price Looks Ready For Another Leg Higher Over $16.5K
Bitcoin price extended its decline and tested the $16,000 support. BTC is forming a base and might soon rise above the $16,500 resistance zone.
Bitcoin declined further and tested the $16,000 support zone.
The price is trading below $16,500 and the 100 hourly simple moving average.
There is a key bearish trend line forming with resistance near $16,500 on the hourly chart of the BTC/USD pair (data feed from Kraken).
The pair could start a decent increase if it clears the $16,500 resistance zone.
Bitcoin Price Remains Supported
Bitcoin price started a downside correction from the $16,800 resistance zone. BTC declined below the $16,500 support level and the 100 hourly simple moving average.
The price even moved below the $16,200 level, but the bulls were active near the $16,000 support zone. A low was formed near $16,000 and the price is now consolidating losses. There was a minor increase above the $16,200 level.
Bitcoin price is now trading below $16,500 and the 100 hourly simple moving average. There is also a key bearish trend line forming with resistance near $16,500 on the hourly chart of the BTC/USD pair.
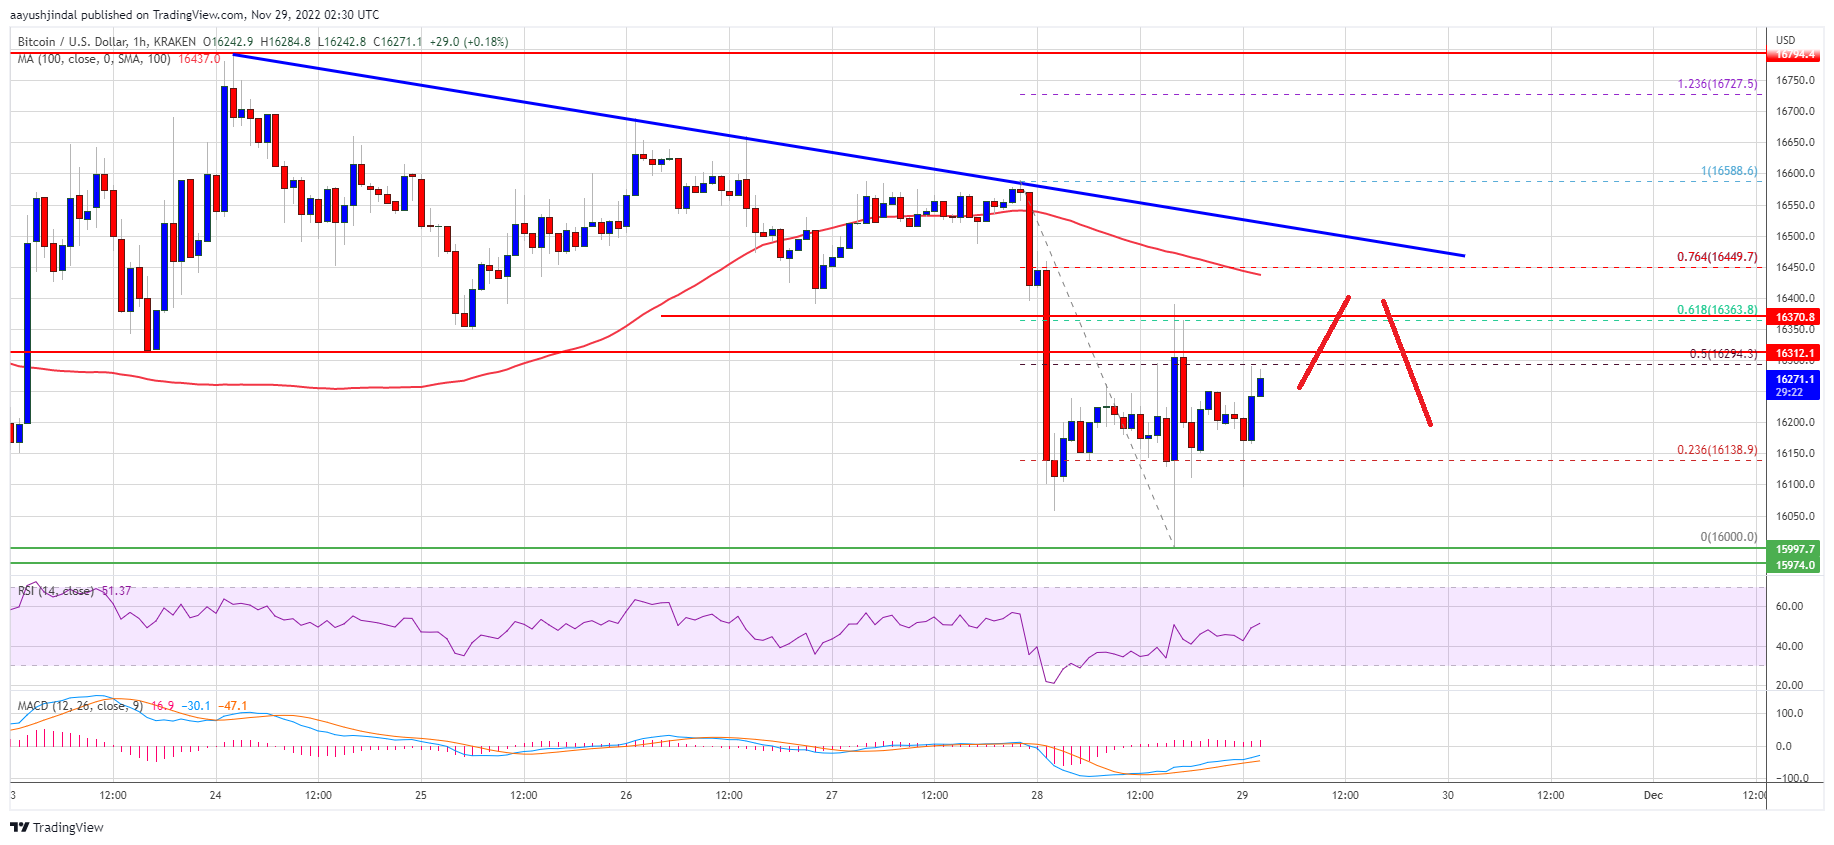
On the upside, an immediate resistance is near the $16,300 level. It is near the 50% Fib retracement level of the downward move from the $16,588 swing high to $16,000 low. The first major resistance is near the $16,500 zone, the trend line, and the 100 hourly simple moving average.
Source: BTCUSD on TradingView.com
The trend line is near the 76.4% Fib retracement level of the downward move from the $16,588 swing high to $16,000 low. A successful move above the $16,500 resistance might start a decent increase. The next major resistance is near $16,800, above which the price could gain pace for a move towards the $17,500 zone.
More Losses in BTC?
If bitcoin fails to climb above the $16,500 resistance, it could struggle to stay in a positive zone. An immediate support on the downside is near the $16,130 level.
The next major support is near the $16,000 zone, below which the price decline further. In the stated case, the price might drop towards the $15,500 support zone.
Technical indicators:
Hourly MACD – The MACD is now gaining pace in the bullish zone.
Hourly RSI (Relative Strength Index) – The RSI for BTC/USD is now above the 50 level.
Major Support Levels – $16,130, followed by $16,000.
Major Resistance Levels – $16,500, $16,800 and $17,000.
Bitcoin price extended its decline and tested the $16,000 support. BTC is forming a base and might soon rise above the $16,500 resistance zone.
Bitcoin declined further and tested the $16,000 support zone.
The price is trading below $16,500 and the 100 hourly simple moving average.
There is a key bearish trend line forming with resistance near $16,500 on the hourly chart of the BTC/USD pair (data feed from Kraken).
The pair could start a decent increase if it clears the $16,500 resistance zone.
Bitcoin Price Remains Supported
Bitcoin price started a downside correction from the $16,800 resistance zone. BTC declined below the $16,500 support level and the 100 hourly simple moving average.
The price even moved below the $16,200 level, but the bulls were active near the $16,000 support zone. A low was formed near $16,000 and the price is now consolidating losses. There was a minor increase above the $16,200 level.
Bitcoin price is now trading below $16,500 and the 100 hourly simple moving average. There is also a key bearish trend line forming with resistance near $16,500 on the hourly chart of the BTC/USD pair.
On the upside, an immediate resistance is near the $16,300 level. It is near the 50% Fib retracement level of the downward move from the $16,588 swing high to $16,000 low. The first major resistance is near the $16,500 zone, the trend line, and the 100 hourly simple moving average.
Source: BTCUSD on TradingView.com
The trend line is near the 76.4% Fib retracement level of the downward move from the $16,588 swing high to $16,000 low. A successful move above the $16,500 resistance might start a decent increase. The next major resistance is near $16,800, above which the price could gain pace for a move towards the $17,500 zone.
More Losses in BTC?
If bitcoin fails to climb above the $16,500 resistance, it could struggle to stay in a positive zone. An immediate support on the downside is near the $16,130 level.
The next major support is near the $16,000 zone, below which the price decline further. In the stated case, the price might drop towards the $15,500 support zone.
Technical indicators:
Hourly MACD – The MACD is now gaining pace in the bullish zone.
Hourly RSI (Relative Strength Index) – The RSI for BTC/USD is now above the 50 level.
Major Support Levels – $16,130, followed by $16,000.
Major Resistance Levels – $16,500, $16,800 and $17,000.
Tags: bitcoinbitcoin pricebtcusdBTCUSDTxbtusd
NewsBTCRead More


Recent Posts
Gamestop CEO Fuels Bitcoin Speculation: $4.6 Billion Buy Incoming?
In a development that has reignited speculation within the Bitcoin community, GameStop CEO Ryan Cohen…
Nansen’s Bitcoin On-Chain Analytics Reveal 42% Increase In BTC Transactions
Blockchain analytics platform Nansen announced the launch of its Bitcoin (BTC) on-chain analytics to bring…
Bitcoin Hashrate Growth Slows Amid Tough Market Conditions for Smaller Miners
After months of rapid expansion, Bitcoin’s hashrate growth slowed down in January, according to the…
On-Chain Metrics Reveal The Most Critical Resistance For Bitcoin – Can BTC Break $97.5K?
Bitcoin continues to trade within a tight range, holding above the $94K level while struggling…
Onramp and Arch Launch Bitcoin-Backed Lending Service
Bitcoin financial services firm Onramp has partnered with lending platform Arch to introduce a bitcoin-backed…
Bitcoin Bulls Rejoice: Fed Minutes Confirm QT Is Ending
On Tuesday, February 19, the Federal Reserve released their meeting minutes, revealing that central bankers…