Bitcoin price remained well bid above the $16,920 support. BTC climbed higher and might soon aim an upside break above the $17,500 resistance zone.
Bitcoin found a strong buying interest near the $16,920 and $16,900 levels.
The price is trading above $17,000 and the 100 hourly simple moving average.
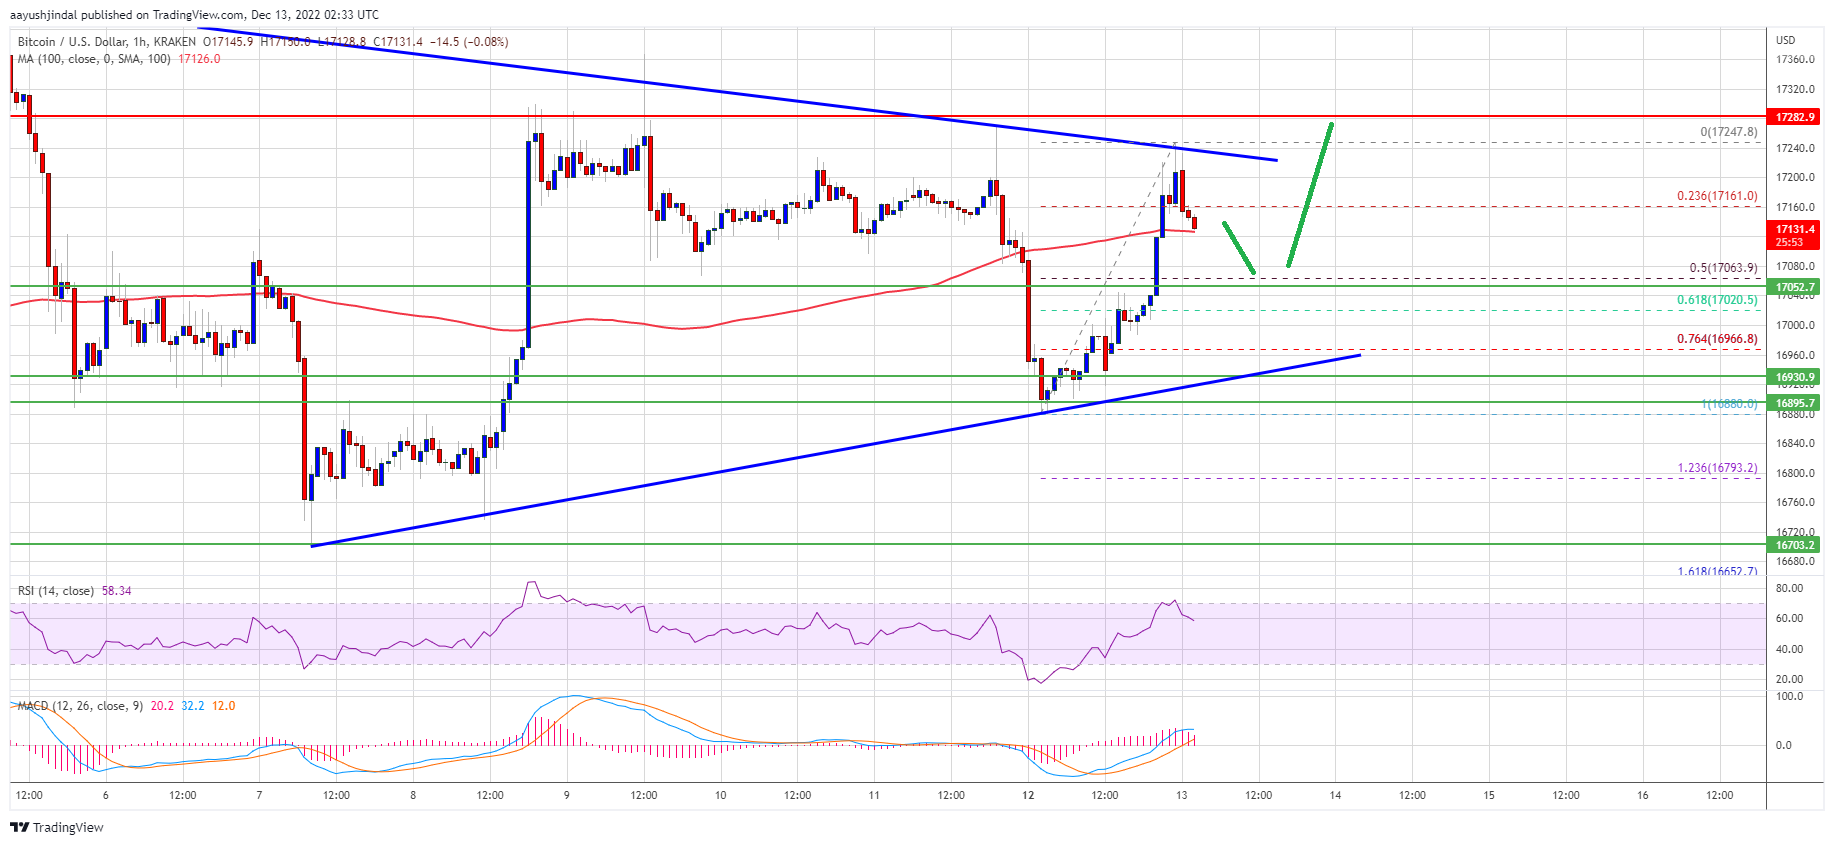
There is a major contracting triangle forming with resistance near $17,220 on the hourly chart of the BTC/USD pair (data feed from Kraken).
The pair could gain bullish momentum if it clears the $17,250 and $17,450 resistance levels.
Bitcoin price corrected lower from the $17,292 swing high. BTC declined below the $17,000 level and the 100 hourly simple moving average.
However, the bulls were active near the $16,920 and $16,900 levels. A low was formed near $16,880 and the price started a fresh increase. There was a clear move above the $17,000 resistance zone and the 100 hourly simple moving average.
Bitcoin price is now consolidating gains near the $17,150 level. There was a minor decline below the 23.6% Fib retracement level of the recent increase from the $16,880 low to $17,247 high.
On the upside, an immediate resistance is near the $17,150 level. There is also a major contracting triangle forming with resistance near $17,220 on the hourly chart of the BTC/USD pair. The first major resistance is near the $17,300 zone, above which the price may perhaps revisit the $17,450 zone.
The next major resistance is near $17,500, above which the price start a steady increase and rise towards the $18,000 zone in the near term.
If bitcoin fails to clear the $17,150 resistance, there could be a fresh decline. An immediate support on the downside is near the $17,120 level and the 100 hourly simple moving average.
The next major support is near the $17,000 zone. It is near the 50% Fib retracement level of the recent increase from the $16,880 low to $17,247 high. A downside break below the $17,000 support might call a drop towards $16,880. Any more losses might push the price towards the $16,500 zone in the near term.
Technical indicators:
Hourly MACD – The MACD is now losing pace in the bullish zone.
Hourly RSI (Relative Strength Index) – The RSI for BTC/USD is now above the 50 level.
Major Support Levels – $17,000, followed by $16,880.
Major Resistance Levels – $17,150, $17,300 and $17,450.
Bitcoin price remained well bid above the $16,920 support. BTC climbed higher and might soon aim an upside break above the $17,500 resistance zone.
Bitcoin found a strong buying interest near the $16,920 and $16,900 levels.
The price is trading above $17,000 and the 100 hourly simple moving average.
There is a major contracting triangle forming with resistance near $17,220 on the hourly chart of the BTC/USD pair (data feed from Kraken).
The pair could gain bullish momentum if it clears the $17,250 and $17,450 resistance levels.
Bitcoin price corrected lower from the $17,292 swing high. BTC declined below the $17,000 level and the 100 hourly simple moving average.
However, the bulls were active near the $16,920 and $16,900 levels. A low was formed near $16,880 and the price started a fresh increase. There was a clear move above the $17,000 resistance zone and the 100 hourly simple moving average.
Bitcoin price is now consolidating gains near the $17,150 level. There was a minor decline below the 23.6% Fib retracement level of the recent increase from the $16,880 low to $17,247 high.
On the upside, an immediate resistance is near the $17,150 level. There is also a major contracting triangle forming with resistance near $17,220 on the hourly chart of the BTC/USD pair. The first major resistance is near the $17,300 zone, above which the price may perhaps revisit the $17,450 zone.
Source: BTCUSD on TradingView.com
The next major resistance is near $17,500, above which the price start a steady increase and rise towards the $18,000 zone in the near term.
If bitcoin fails to clear the $17,150 resistance, there could be a fresh decline. An immediate support on the downside is near the $17,120 level and the 100 hourly simple moving average.
The next major support is near the $17,000 zone. It is near the 50% Fib retracement level of the recent increase from the $16,880 low to $17,247 high. A downside break below the $17,000 support might call a drop towards $16,880. Any more losses might push the price towards the $16,500 zone in the near term.
Technical indicators:
Hourly MACD – The MACD is now losing pace in the bullish zone.
Hourly RSI (Relative Strength Index) – The RSI for BTC/USD is now above the 50 level.
Major Support Levels – $17,000, followed by $16,880.
Major Resistance Levels – $17,150, $17,300 and $17,450.
Tags: bitcoinbitcoin pricebtcusdBTCUSDTxbtusd
NewsBTCRead More
Disclaimer: The analyst who wrote this piece owns shares of Strategy (MSTR). Bitcoin's sharp price…
Crypto analyst Kevin Capital has provided insights into where the Bitcoin price may be headed…
Bitcoin’s price fell to $86,099 on February 26th, wiping out almost $1.06 billion from crypto’s…
Shares of Strategy (NASDAQ: MSTR) have dropped by over 55% from the November 24 high…
Bitcoin’s recent price crash took the entire market by surprise, leaving bullish investors reeling in…
Genesis Digital Assets Limited (GDA) is expanding its bitcoin (BTC) mining operations in West Texas…