Bitcoin price is up over 10% and surging toward $58,000. BTC is signaling a strong upward trend and might surge toward the $60,000 resistance.
Bitcoin price is gaining pace above the $55,000 resistance zone.
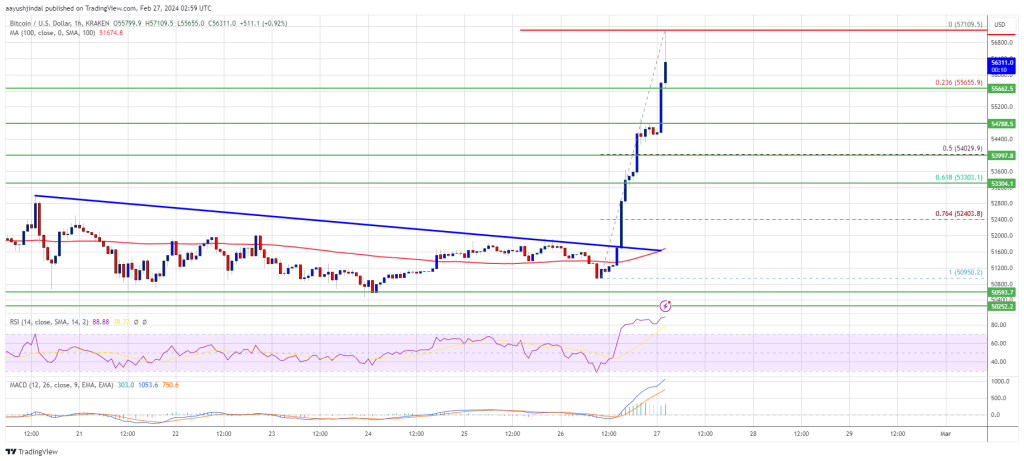
The price is trading above $55,000 and the 100 hourly Simple moving average.
There was a break above a major bearish trend line with resistance at $51,600 on the hourly chart of the BTC/USD pair (data feed from Kraken).
The pair could extend its current rally toward the $60,000 resistance zone.
Bitcoin price remained well-bid above the $50,500 support zone. A support base was formed above the $51,500 level and the price started a fresh rally. BTC gained bullish momentum after it broke the $51,600 and $52,000 resistance levels.
There was a break above a major bearish trend line with resistance at $51,600 on the hourly chart of the BTC/USD pair. The pair surged over 10% and broke many hurdles near the $55,000 level. A new multi-week high is formed near $57,109 and the price is now retreating.
Bitcoin is still trading above $55,000 and the 100 hourly Simple moving average. It is also above the 23.6% Fib retracement level of the recent rally from the $50,950 swing low to the $57,109 high.
Source: BTCUSD on TradingView.com
Immediate resistance is near the $56,800 level. The next key resistance could be $57,000, above which the price could rise toward the $58,000 resistance zone. If the bulls remain in action, the price could even surpass $58,000 and test $58,800. The main hurdle for them is visible near the $60,000 zone.
If Bitcoin fails to rise above the $57,000 resistance zone, it could start a downside correction. Immediate support on the downside is near the $56,000 level.
The first major support is $55,600. If there is a close below $55,600, the price could start a decent pullback toward the 50% Fib retracement level of the recent rally from the $50,950 swing low to the $57,109 high. Any more losses might send the price toward the $53,200 support zone.
Technical indicators:
Hourly MACD – The MACD is now gaining pace in the bullish zone.
Hourly RSI (Relative Strength Index) – The RSI for BTC/USD is now above the 50 level.
Major Support Levels – $56,000, followed by $55,600.
Major Resistance Levels – $57,000, $58,000, and $60,000.
[#item_full_content]NewsBTCRead MoreBitcoin banks are going to happen. We already have a few of them. We’re going…
There have been recent concerns within the crypto community regarding Binance’s recent activities after a…
By launching its Macro Strategic Reserve, World Liberty Financial (WLFI) has advanced significantly and strengthened…
Bitcoin (BTC) continues to move within its one-week range after recovering from its recent drop…
Alexander Vinnik, the jailed former operator of once mighty bitcoin exchange BTC-e, is being released…
Founder: Nicolas Burtey Date Founded: September 2019 Location of Headquarters: United States Number of Employees:…