Bitcoin price started a fresh declined below the $100,000 zone. BTC is down close to 10% and might test the $90,000 support zone.
Bitcoin started a fresh decline below the $100,000 level.
The price is trading below $99,500 and the 100 hourly Simple moving average.
There is a key bearish trend line forming with resistance at $96,200 on the hourly chart of the BTC/USD pair (data feed from Kraken).
The pair could start another increase if it stays above the $90,000 zone.
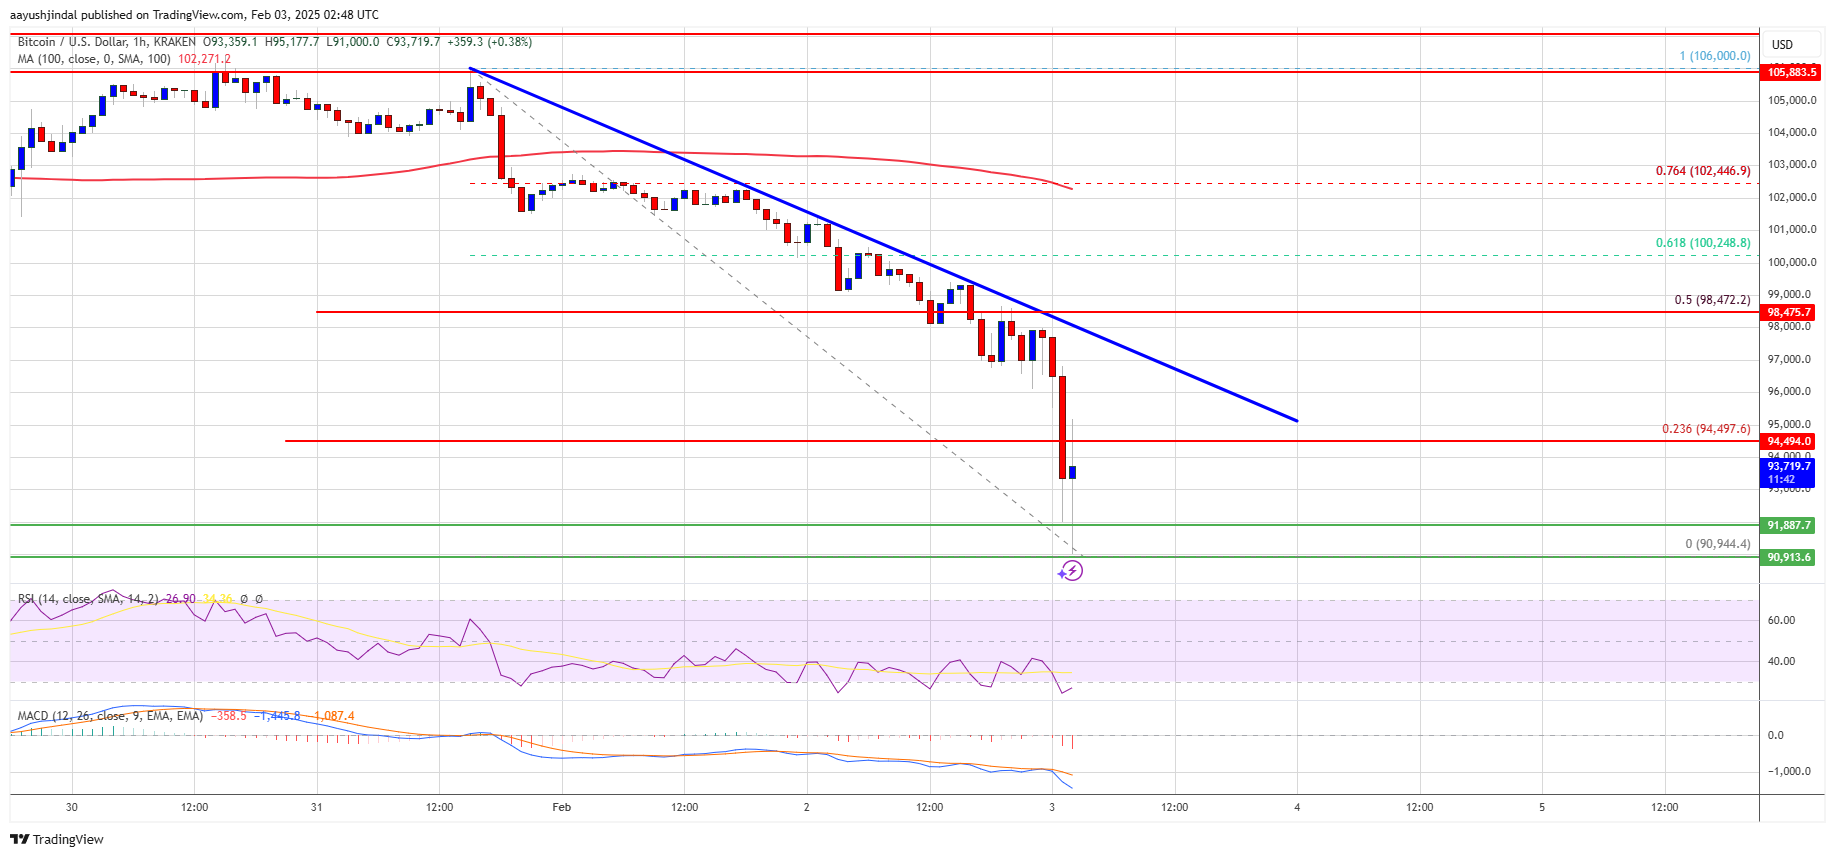
Bitcoin price started another decline below the $100,000 zone. BTC gained bearish momentum for a move below the $98,000 and $95,000 levels. It even dived below $93,000.
A low was formed at $90,944 and the price is now consolidating losses. There was a minor increase above the $92,500 level. The price even tested the 23.6% Fib retracement level of the downward move from the $106,000 swing high to the $90,944 low. However, the bears are now active near the $95,000 zone.
Bitcoin price is now trading below $95,000 and the 100 hourly Simple moving average. On the upside, immediate resistance is near the $95,000 level. The first key resistance is near the $96,500 level. There is also a key bearish trend line forming with resistance at $96,200 on the hourly chart of the BTC/USD pair.
The next key resistance could be $98,400 or the 50% Fib retracement level of the downward move from the $106,000 swing high to the $90,944 low. A close above the $98,500 resistance might send the price further higher. In the stated case, the price could rise and test the $96,800 resistance level. Any more gains might send the price toward the $100,000 level.
If Bitcoin fails to rise above the $95,000 resistance zone, it could start a fresh decline. Immediate support on the downside is near the $92,500 level. The first major support is near the $92,000 level.
The next support is now near the $90,000 zone. Any more losses might send the price toward the $88,500 support in the near term.
Technical indicators:
Hourly MACD – The MACD is now gaining pace in the bearish zone.
Hourly RSI (Relative Strength Index) – The RSI for BTC/USD is now below the 50 level.
Major Support Levels – $92,500, followed by $90,000.
Major Resistance Levels – $95,000 and $96,500.
[#item_full_content]NewsBTCRead MoreBitcoin Twitter (or Bitcoin X) is having a moment after a 13F filing by Goldman…
After a relatively subdued price performance in 2024, Ethereum (ETH) could be on the verge…
In El Salvador, about two hours away from the capital, up in the mountains, lies…
Bitcoin has experienced a challenging period recently, with its price consistently declining over the past…
U.S. inflation unexpectedly marched higher in January, sending crypto and traditional markets sharply lower. The…
World Liberty Financial (WLFI), a crypto project Trump has financial interests in, has launched a…