Bitcoin price gained over 10% and broke the $64,000 resistance level. BTC is showing positive signs and might attempt to move above the $65,000 level.
Bitcoin gained bullish momentum above the $63,500 resistance zone.
The price is trading above $63,500 and the 100 hourly Simple moving average.
There is a major bullish trend line forming with support at $62,200 on the hourly chart of the BTC/USD pair (data feed from Kraken).
The pair might continue to move up if it breaks the $65,000 resistance.
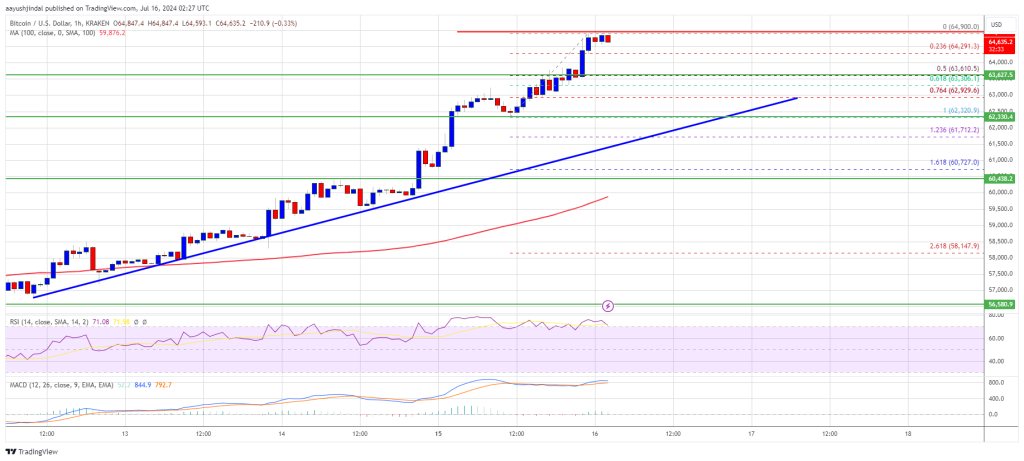
Bitcoin price started a major increase above the $61,500 and $62,000 resistance levels. BTC even cleared the $63,500 resistance to move further into a positive zone. The bulls pushed the price toward the $65,000 zone.
A high was formed at $64,900 and the price is now consolidating gains. It is trading well above the 23.6% Fib retracement level of the upward move from the $62,320 swing low to the $64,900 high. There is also a major bullish trend line forming with support at $62,200 on the hourly chart of the BTC/USD pair.
Bitcoin price is now trading above $64,000 and the 100 hourly Simple moving average. If there is an upside continuation, the price could face resistance near the $64,800 level. The first key resistance is near the $65,000 level.
A clear move above the $65,000 resistance might start a decent increase in the coming sessions. The next key resistance could be $66,200. The next major hurdle sits at $66,500. A close above the $66,500 resistance might start a steady increase and send the price higher. In the stated case, the price could rise and test the $67,000 resistance.
If Bitcoin fails to climb above the $65,000 resistance zone, it could start a downside correction. Immediate support on the downside is near the $64,250 level.
The first major support is $63,650 and the 50% Fib retracement level of the upward move from the $62,320 swing low to the $64,900 high. The next support is now near $62,500. Any more losses might send the price toward the $61,500 support zone in the near term.
Technical indicators:
Hourly MACD – The MACD is now gaining pace in the bullish zone.
Hourly RSI (Relative Strength Index) – The RSI for BTC/USD is now above the 50 level.
Major Support Levels – $64,250, followed by $63,650.
Major Resistance Levels – $65,000, and $66,200.
[#item_full_content]NewsBTCRead MoreThe U.S. Securities and Exchange Commission approved another joint bitcoin and ether exchange-traded fund (ETF)…
San Salvador — Tether, the crypto company behind the largest stablecoin, is introducing its $140…
Follow me on X for more Bitcoin Alpha https://x.com/GuerillaV2 Earlier today at the Plan B…
Bitcoin (BTC) has seen an impressive 8% surge since Monday, solidifying $100K as a strong…
Could Bitcoin (BTC) soon find its way on to the balance sheet of a European…
I was recently having a conversation with a friend in Kenya who described how difficult…