Bitcoin Price Prediction: This Scenario Will Trigger A Fresh Drop
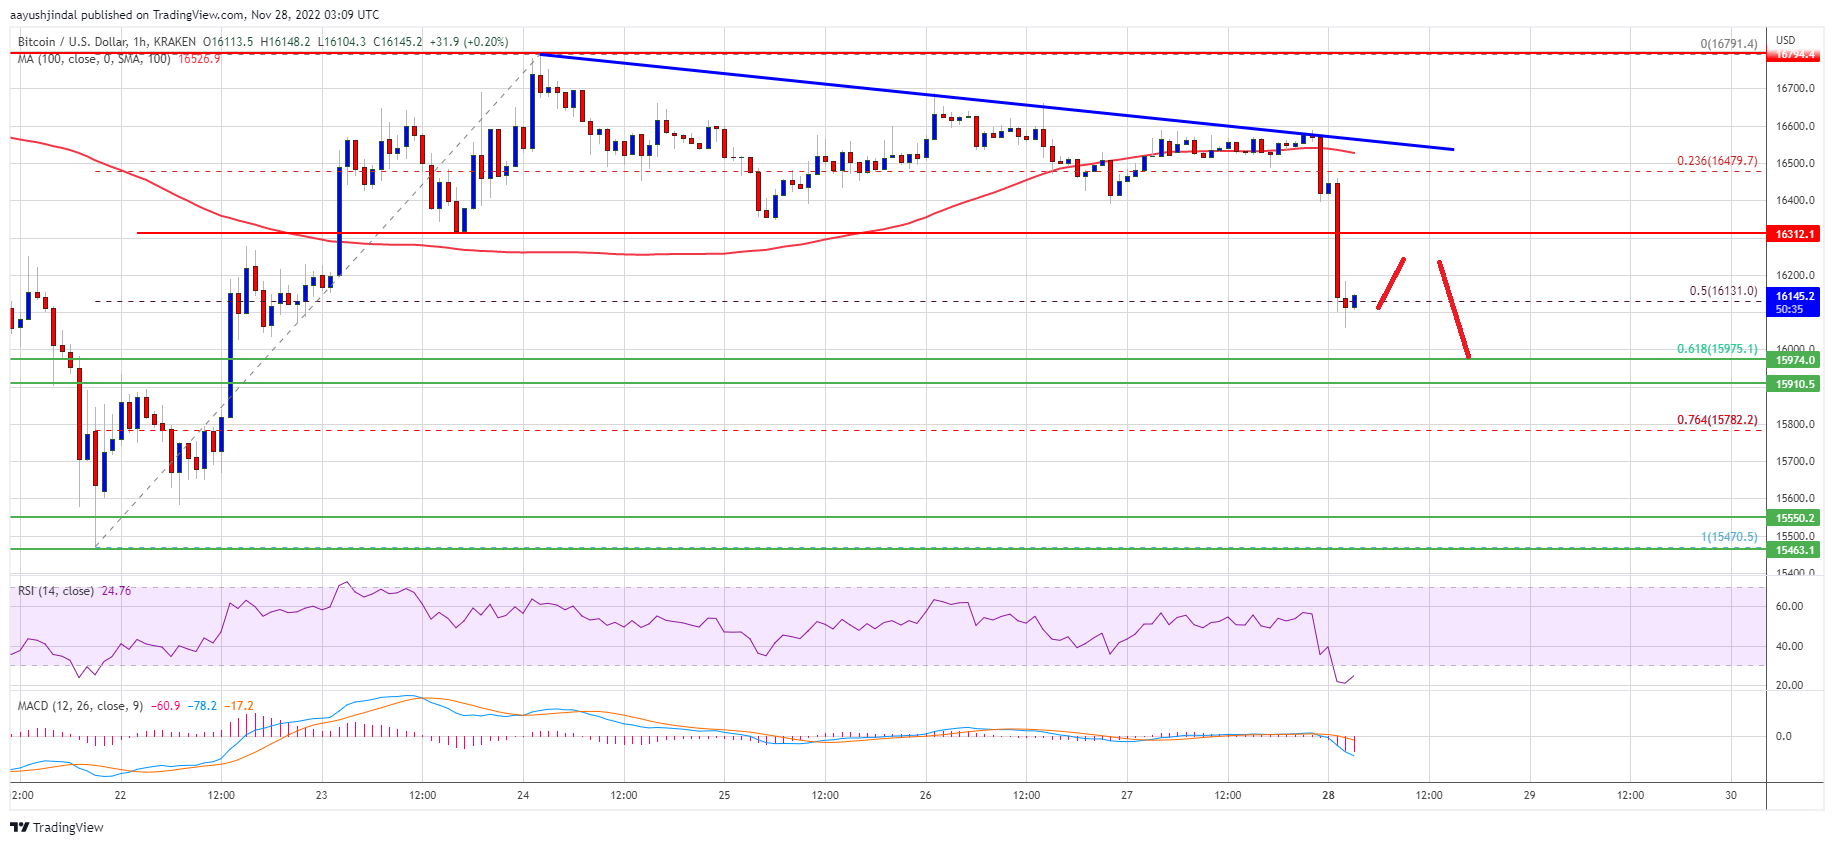
Bitcoin price struggled to clear the $16,800 resistance. BTC is moving lower and there is a risk of more losses below the $16,000 support zone.
Bitcoin attempted an upside break above the $16,800 resistance, but failed.
The price is trading below $16,500 and the 100 hourly simple moving average.
There is a major bearish trend line forming with resistance near $16,550 on the hourly chart of the BTC/USD pair (data feed from Kraken).
The pair could continue to decline if it breaks the $16,000 support zone.
Bitcoin Price Faces Rejection
Bitcoin price attempted an upside break above the $16,800 resistance zone. BTC struggled to gain pace for a move above the $16,800 resistance and formed a double top pattern.
There was a slow and steady decline from the $16,791 high. There was a move below the $16,500 and $16,400 levels. The bears were able to push the price below the 23.6% Fib retracement level of the upward move from the $15,470 swing low to $16,790 high.
Bitcoin price is now trading below $16,500 and the 100 hourly simple moving average. There is also a major bearish trend line forming with resistance near $16,550 on the hourly chart of the BTC/USD pair.
The price is now consolidating near the 50% Fib retracement level of the upward move from the $15,470 swing low to $16,790 high. On the upside, an immediate resistance is near the $16,300 level.
Source: BTCUSD on TradingView.com
The first major resistance is near the $16,500 zone, the 100 hourly simple moving average, and the highlighted bearish trend line. A successful move above the $16,500 resistance might send the price further higher. The next major resistance is near $16,800, above which the price could gain pace for a move towards the $17,500 zone.
More Losses in BTC?
If bitcoin fails to climb above the $16,500 resistance, it could continue to move down. An immediate support on the downside is near the $16,100 level.
The next major support is near the $16,000 zone, below which the price might gain bearish momentum. In the stated case, the price might drop towards the $15,500 support zone.
Technical indicators:
Hourly MACD – The MACD is now gaining pace in the bearish zone.
Hourly RSI (Relative Strength Index) – The RSI for BTC/USD is now below the 50 level.
Major Support Levels – $16,100, followed by $16,000.
Major Resistance Levels – $16,500, $16,800 and $17,000.
Tags: bitcoinbitcoin pricebtcusdBTCUSDTxbtusd
NewsBTCRead More


Recent Posts
Bitcoin Price Outlook: Will BTC Rebound Or Drop To $76,000?
The price of Bitcoin (BTC) has shown only sideways movement in the last day resulting…
Bitcoin Network Activity Is Declining — Impact On Price?
A sluggish Bitcoin price performance has not been the only disappointing theme for the largest…
Best Cryptocurrencies to Buy as Trump’s WLFI Increases Holdings in $WBTC and $MOVE
World Liberty Financial, Trump’s crypto company, is making moves again. It recently bought another $1.4M…
Strategy Could Be Eligible for S&P 500 Inclusion in June if Bitcoin Closes Q1 Above $96K
Disclaimer: The analyst who wrote this piece owns shares of Strategy (MSTR) Strategy (MSTR) could…
No $200K Bitcoin? Popular Trader Explains Why It’s Unlikely This Decade
Peter Brandt, a seasoned trader, has dismissed optimistic predictions in the wake of Bitcoin’s recent…
El Salvador Dispatch: How Bitcoin Taught a Nation to Dream
This article is part of a four-piece series on El Salvador. You can find the…