Bitcoin Price Prints Bearish Technical Pattern, Why It Could Continue Lower
Bitcoin price declined heavily and traded below $17,000. BTC is consolidating losses and remains at a risk of more losses below the $16,500 support.
Bitcoin started a fresh decline below the $17,200 and $17,000 support levels.
The price is trading below $17,000 and the 100 hourly simple moving average.
There is a key bearish trend line forming with resistance near $16,800 on the hourly chart of the BTC/USD pair (data feed from Kraken).
The pair could continue to move lower unless it clears the 100 hourly SMA.
Bitcoin Price Tumbles
Bitcoin price restarted a fresh decline from the $18,400 zone resistance zone. BTC gained pace below the $17,500 and $17,200 support levels. The bears even pushed it below the $17,000 level and the 100 hourly simple moving average.
It tested the $16,500 support zone. A low is formed near $16,541 and the price is now consolidating losses. It climbed a few points higher and traded above the $16,700 level.
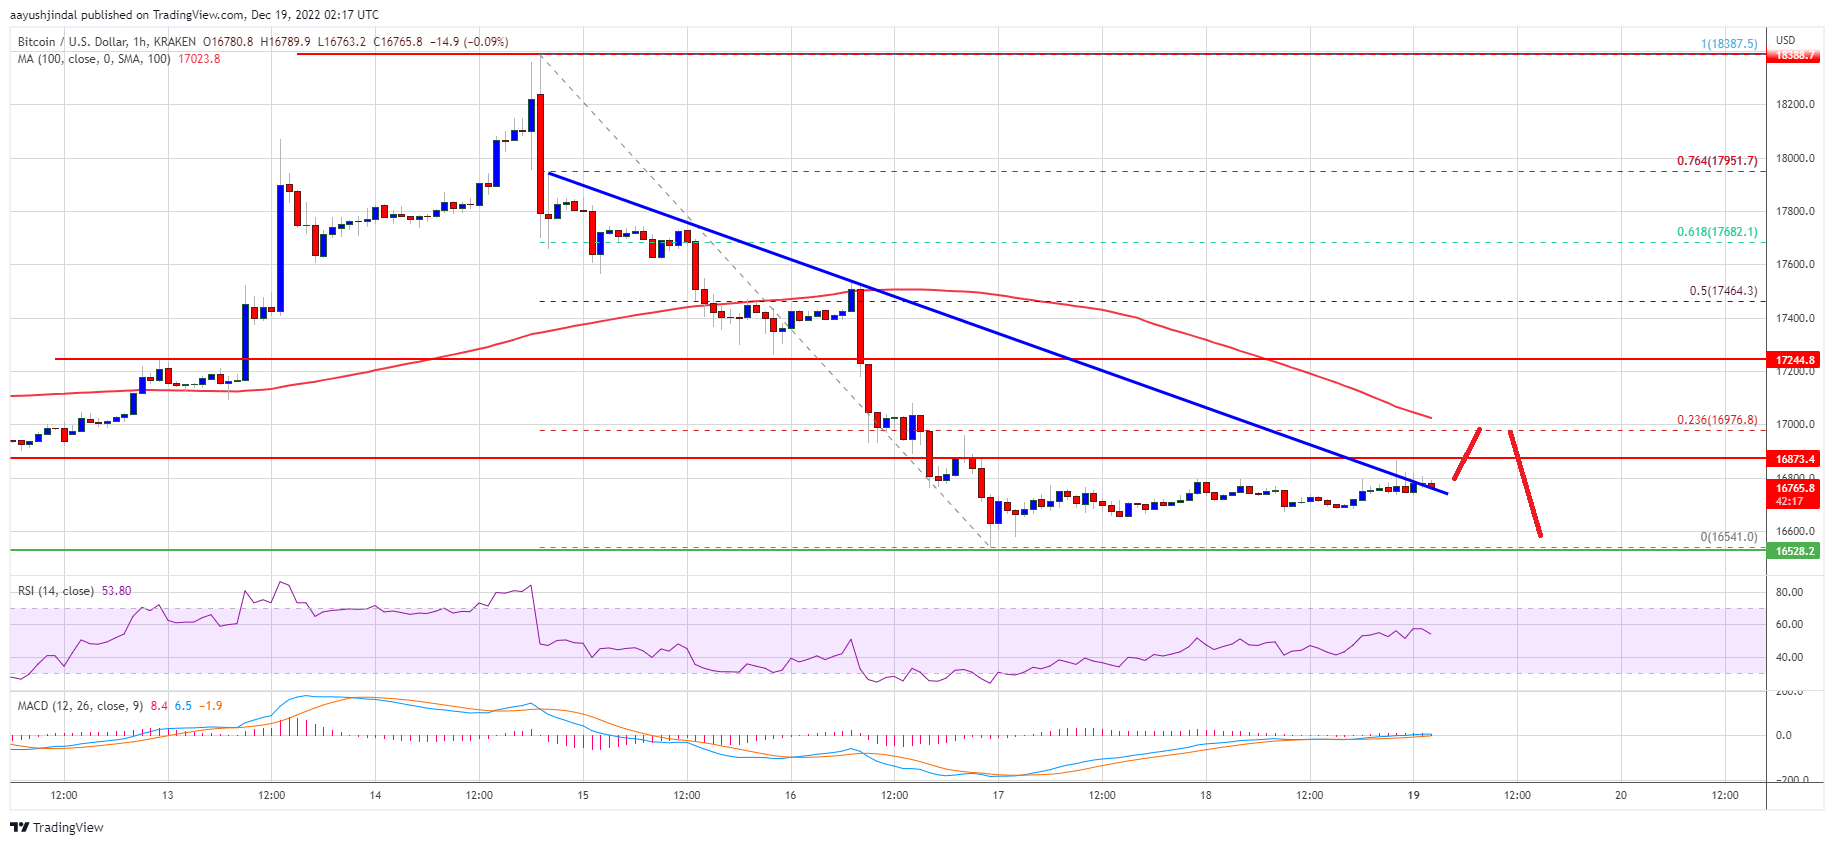
Bitcoin price is now trading below $17,000 and the 100 hourly simple moving average. On the upside, an immediate resistance is near the $16,800 zone. There is also a key bearish trend line forming with resistance near $16,800 on the hourly chart of the BTC/USD pair.
The first major resistance is near the $17,000 zone and the 100 hourly simple moving average. It is near the 23.6% Fib retracement level of the downward move from the $18,387 swing high to $16,541 swing low.
Source: BTCUSD on TradingView.com
A clear move above the $17,000 resistance might call for a move towards the $17,500 resistance. It is close to the 50% Fib retracement level of the downward move from the $18,387 swing high to $16,541 swing low. The next major resistance is near $17,800, above which the price might gain pace and rise towards the $18,000 level.
More Losses in BTC?
If bitcoin fails to clear the $17,000 resistance, there could be more downsides. An immediate support on the downside is near the $16,600 level.
The next major support is near the $16,500 zone. A downside break below the $16,500 support might call more losses. In the stated case, the price could decline towards the $16,000 support in the near term. Any more losses might send the price towards $15,500.
Technical indicators:
Hourly MACD – The MACD is now losing pace in the bearish zone.
Hourly RSI (Relative Strength Index) – The RSI for BTC/USD is now above the 50 level.
Major Support Levels – $16,600, followed by $16,500.
Major Resistance Levels – $16,800, $17,000 and $17,500.
Bitcoin price declined heavily and traded below $17,000. BTC is consolidating losses and remains at a risk of more losses below the $16,500 support.
Bitcoin started a fresh decline below the $17,200 and $17,000 support levels.
The price is trading below $17,000 and the 100 hourly simple moving average.
There is a key bearish trend line forming with resistance near $16,800 on the hourly chart of the BTC/USD pair (data feed from Kraken).
The pair could continue to move lower unless it clears the 100 hourly SMA.
Bitcoin Price Tumbles
Bitcoin price restarted a fresh decline from the $18,400 zone resistance zone. BTC gained pace below the $17,500 and $17,200 support levels. The bears even pushed it below the $17,000 level and the 100 hourly simple moving average.
It tested the $16,500 support zone. A low is formed near $16,541 and the price is now consolidating losses. It climbed a few points higher and traded above the $16,700 level.
Bitcoin price is now trading below $17,000 and the 100 hourly simple moving average. On the upside, an immediate resistance is near the $16,800 zone. There is also a key bearish trend line forming with resistance near $16,800 on the hourly chart of the BTC/USD pair.
The first major resistance is near the $17,000 zone and the 100 hourly simple moving average. It is near the 23.6% Fib retracement level of the downward move from the $18,387 swing high to $16,541 swing low.
Source: BTCUSD on TradingView.com
A clear move above the $17,000 resistance might call for a move towards the $17,500 resistance. It is close to the 50% Fib retracement level of the downward move from the $18,387 swing high to $16,541 swing low. The next major resistance is near $17,800, above which the price might gain pace and rise towards the $18,000 level.
More Losses in BTC?
If bitcoin fails to clear the $17,000 resistance, there could be more downsides. An immediate support on the downside is near the $16,600 level.
The next major support is near the $16,500 zone. A downside break below the $16,500 support might call more losses. In the stated case, the price could decline towards the $16,000 support in the near term. Any more losses might send the price towards $15,500.
Technical indicators:
Hourly MACD – The MACD is now losing pace in the bearish zone.
Hourly RSI (Relative Strength Index) – The RSI for BTC/USD is now above the 50 level.
Major Support Levels – $16,600, followed by $16,500.
Major Resistance Levels – $16,800, $17,000 and $17,500.
Tags: bitcoinbitcoin pricebtcusdBTCUSDTxbtusd
NewsBTCRead More


Recent Posts
Elon Musk Announces ‘Bitcoin-Style’ XChat, But Tech Experts Are Skeptical
Tech billionaire Elon Musk, the boss of X (formerly Twitter), Tesla, and SpaceX, announced on…
Asia Morning Briefing: BTC Stalls at 105K as Analyst Says Market Looks ‘Overheated’
Good Morning, Asia. Here's what's making news in the markets: Welcome to Asia Morning Briefing,…
Bitcoin Price Eyes New Gains — Is the Next Leg Higher Starting?
Bitcoin price started a fresh decline and tested the $103,200 zone. BTC is now consolidating…
Bitcoin Tipped For $340,000 Target If This Support Level Holds – Details
A prominent crypto analyst with X username PlanD has backed Bitcoin to maintain its uptrend…
Best Altcoins to Buy Before Bitcoin Becomes ‘Exponentially Harder to Buy’
‘No force on earth can stop it’ is what Michael Saylor, Strategy’s founder, had to…
Bitcoin Maxi Max Keiser Isn’t Buying The Hype Around New Crypto Holding Companies
Bitcoin advocate Max Keiser has questioned whether new Bitcoin treasury companies will show the same…