Bitcoin price recovered above the $62,000 resistance zone. BTC must clear the $62,500 resistance zone to continue higher in the near term.
Bitcoin started a recovery wave above the $61,500 and $62,000 levels.
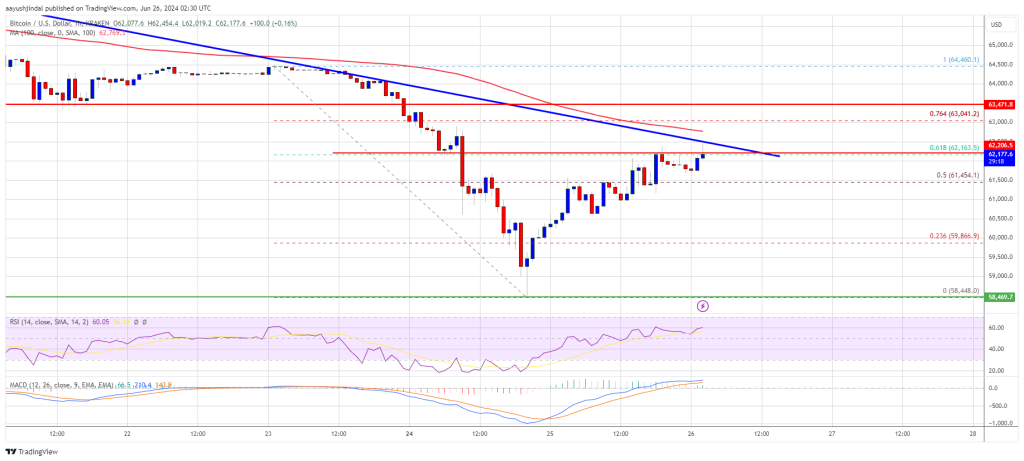
The price is trading below $63,000 and the 100 hourly Simple moving average.
There is a key bearish trend line forming with resistance at $62,500 on the hourly chart of the BTC/USD pair (data feed from Kraken).
The pair might struggle to rise above the $62,500 and $63,000 resistance levels.
Bitcoin price extended losses below the $60,000 support zone. BTC even tested the $58,500 support zone, where the bulls emerged. A low was formed at $58,448 and the price is now correcting losses. There was a decent increase above the $60,000 level.
The price climbed above the 50% Fib retracement level of the downward wave from the $64,460 swing high to the $58,448 low. It even moved above the $62,000 pivot level. However, Bitcoin price is still trading below $63,000 and the 100 hourly Simple moving average.
The price seems to be facing a rejection zone near the $62,500 resistance, as discussed yesterday. There is also a key bearish trend line forming with resistance at $62,500 on the hourly chart of the BTC/USD pair. It is close to the 61.8% Fib retracement level of the downward wave from the $64,460 swing high to the $58,448 low.
The next key resistance could be $63,000. A clear move above the $63,000 resistance might start a steady increase and send the price higher. In the stated case, the price could rise and test the $63,500 resistance. Any more gains might send BTC toward the $65,000 resistance in the near term.
If Bitcoin fails to climb above the $62,500 resistance zone, it could start another decline. Immediate support on the downside is near the $60,500 level.
The first major support is $60,000. The next support is now forming near $59,500. Any more losses might send the price toward the $58,500 support zone in the near term.
Technical indicators:
Hourly MACD – The MACD is now gaining pace in the bullish zone.
Hourly RSI (Relative Strength Index) – The RSI for BTC/USD is now above the 50 level.
Major Support Levels – $60,500, followed by $60,000.
Major Resistance Levels – $62,500, and $63,000.
[#item_full_content]NewsBTCRead MoreBitcoin (BTC) is flat as East Asian markets open for the week, trading above $84K,…
Bitcoin price started a fresh increase above the $82,500 zone. BTC is now consolidating gains…
The Bitcoin price action this weekend has been quite bubbly and impressive, with the premier…
Bitcoin (BTC) proponent Michael Saylor has hinted the company he co-founded, Strategy (MSTR), may be…
The price of Bitcoin has found its way back above the $85,000 mark, marking a…
Bitcoin has broken out of a technical formation that may place it on track toward…