Bitcoin Price Recovery Remains Capped, Why 100 SMA Is The Key
Bitcoin price started an upside correction from $15,500. BTC is now facing a strong resistance near the $16,300 zone and the 100 hourly SMA.
Bitcoin found support near $15,500 and started an upside correction.
The price is trading below $16,300 and the 100 hourly simple moving average.
There is a crucial bearish trend line forming with resistance near $16,200 on the hourly chart of the BTC/USD pair (data feed from Kraken).
The pair could continue to rise if it clears the $16,300 level and the 100 hourly SMA.
Bitcoin Price Eyes Recovery
Bitcoin price extended its decline below the $16,000 support level. BTC even spiked below the $15,800 support level, but the bulls were active near the $15,500 level.
A low was formed near $15,470 and the price started an upside correction. There was a move above the $15,800 and $16,000 resistance levels. The bulls were able to push the price above the 50% Fib retracement level of the key decline from the $16,795 swing high to $15,470 low.
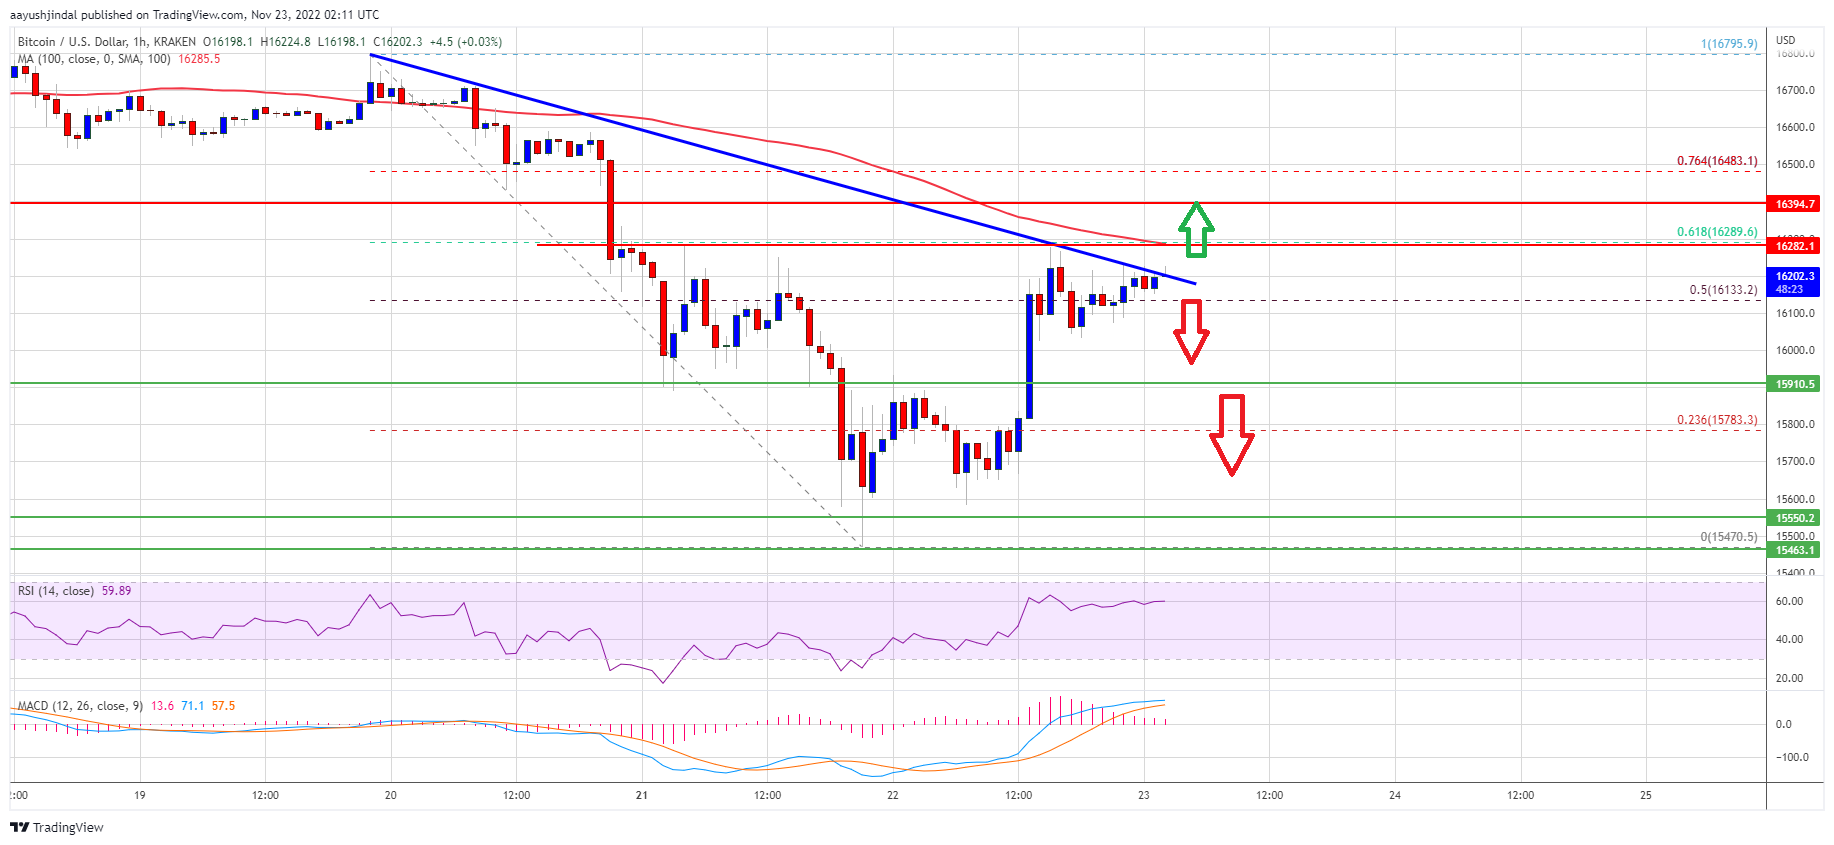
Bitcoin price is now trading below $16,300 and the 100 hourly simple moving average. There is also a crucial bearish trend line forming with resistance near $16,200 on the hourly chart of the BTC/USD pair.
On the upside, an immediate resistance is near the $16,200 level. The first major resistance is near the $16,300 zone and the 100 hourly simple moving average. It is close to the 61.8% Fib retracement level of the key decline from the $16,795 swing high to $15,470 low.
Source: BTCUSD on TradingView.com
The price must clear the trend line resistance and then $16,300 to start a decent recovery wave. The next major resistance is near $16,500, above which the price could gain pace for a move towards the $17,000 zone.
Fresh Decline in BTC?
If bitcoin fails to recover above the $16,300 resistance zone, it could start another decline. An immediate support on the downside is near the $15,900 level.
The next major support is near the $15,550 zone, below which the price might even struggle to stay above $15,500. A clear move below the $15,500 support might send the price towards the $14,000 support zone.
Technical indicators:
Hourly MACD – The MACD is now losing pace in the bullish zone.
Hourly RSI (Relative Strength Index) – The RSI for BTC/USD is now above the 50 level.
Major Support Levels – $15,900, followed by $15,500.
Major Resistance Levels – $16,200, $16,300 and $17,000.
Bitcoin price started an upside correction from $15,500. BTC is now facing a strong resistance near the $16,300 zone and the 100 hourly SMA.
Bitcoin found support near $15,500 and started an upside correction.
The price is trading below $16,300 and the 100 hourly simple moving average.
There is a crucial bearish trend line forming with resistance near $16,200 on the hourly chart of the BTC/USD pair (data feed from Kraken).
The pair could continue to rise if it clears the $16,300 level and the 100 hourly SMA.
Bitcoin Price Eyes Recovery
Bitcoin price extended its decline below the $16,000 support level. BTC even spiked below the $15,800 support level, but the bulls were active near the $15,500 level.
A low was formed near $15,470 and the price started an upside correction. There was a move above the $15,800 and $16,000 resistance levels. The bulls were able to push the price above the 50% Fib retracement level of the key decline from the $16,795 swing high to $15,470 low.
Bitcoin price is now trading below $16,300 and the 100 hourly simple moving average. There is also a crucial bearish trend line forming with resistance near $16,200 on the hourly chart of the BTC/USD pair.
On the upside, an immediate resistance is near the $16,200 level. The first major resistance is near the $16,300 zone and the 100 hourly simple moving average. It is close to the 61.8% Fib retracement level of the key decline from the $16,795 swing high to $15,470 low.
Source: BTCUSD on TradingView.com
The price must clear the trend line resistance and then $16,300 to start a decent recovery wave. The next major resistance is near $16,500, above which the price could gain pace for a move towards the $17,000 zone.
Fresh Decline in BTC?
If bitcoin fails to recover above the $16,300 resistance zone, it could start another decline. An immediate support on the downside is near the $15,900 level.
The next major support is near the $15,550 zone, below which the price might even struggle to stay above $15,500. A clear move below the $15,500 support might send the price towards the $14,000 support zone.
Technical indicators:
Hourly MACD – The MACD is now losing pace in the bullish zone.
Hourly RSI (Relative Strength Index) – The RSI for BTC/USD is now above the 50 level.
Major Support Levels – $15,900, followed by $15,500.
Major Resistance Levels – $16,200, $16,300 and $17,000.
Tags: bitcoinbitcoin pricebtcusdBTCUSDTxbtusd
NewsBTCRead More


Recent Posts
Analyst Suggests Altcoin Recovery May Follow Bitcoin’s Final Cycle Stage—Here’s Why
Bitcoin continues to showcase resilience in the current cryptocurrency market cycle, consistently setting new records…
Bitcoin Warning Signs? Long-Term Holders Exit While Retail Buyers Rush In
As Bitcoin (BTC) retreats from its recent all-time high (ATH) of $111,814 – currently trading…
Binance Taker Buy/Sell Ratio Falls Below 1.0 as Bitcoin Sees Renewed Selling
Bitcoin (BTC) has experienced a noticeable retracement after recently achieving a record high above $111,000…
Meta Shareholders Overwhelmingly Reject Proposal to Consider Bitcoin Treasury Strategy
Meta (META) shareholders have overwhelmingly voted against a proposal to add bitcoin BTC to the…
Tether Group & Bitfinex Transferred 25,812 BTC to Jack Mallers’ Twenty One Capital
Bitcoin Magazine Tether Group & Bitfinex Transferred 25,812 BTC to Jack Mallers’ Twenty One Capital…
Bitcoin Vs. M2: Abra CEO Sees $130,000 As Liquidity Floods In
Bill Barhydt, the founder and chief executive of crypto-banking platform Abra, set Crypto-X alight over…