Bitcoin price is gaining pace above the $42,500 resistance. BTC is showing positive signs and might extend its increase toward the $45,000 resistance.
Bitcoin price is moving higher above the $42,500 resistance zone.
The price is trading above $43,000 and the 100 hourly Simple moving average.
There is a major bullish trend line forming with support near $42,150 on the hourly chart of the BTC/USD pair (data feed from Kraken).
The pair could continue to rise if it clears the $43,800 and $44,200 resistance levels.
Bitcoin price started a decent increase above the $41,200 resistance zone. BTC was able to clear the $42,500 and $42,800 resistance levels to move further into a positive zone.
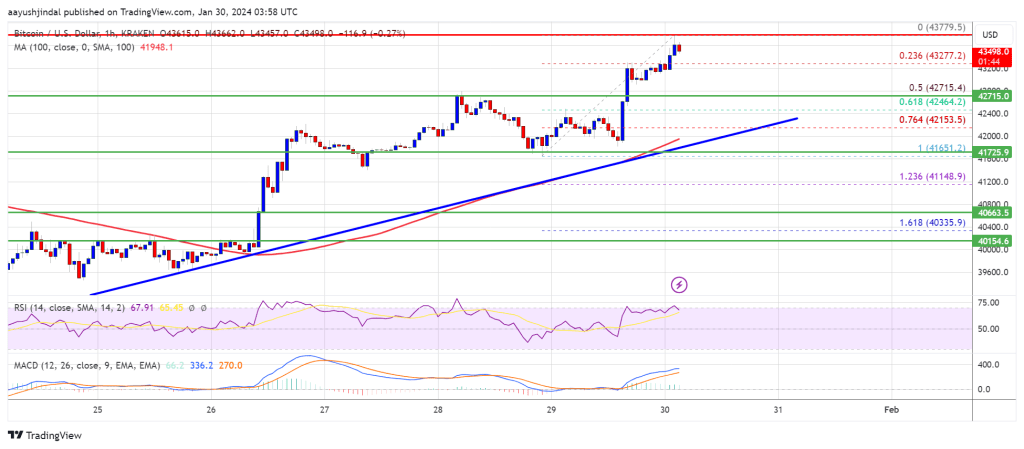
The bulls pushed the price above the $43,000 resistance and the price pumped toward $43,800. A new weekly high is formed near $43,779 and the price is now consolidating gains. It is trading above the 23.6% Fib retracement level of the upward move from the $41,651 swing low to the $43,779 high.
Bitcoin is now trading above $43,000 and the 100 hourly Simple moving average. There is also a major bullish trend line forming with support near $42,150 on the hourly chart of the BTC/USD pair. The trend line is near the 76.4% Fib retracement level of the upward move from the $41,651 swing low to the $43,779 high.
Immediate resistance is near the $43,800 level. The next key resistance could be $44,200, above which the price could rise and test $44,500. A clear move above the $44,500 resistance could send the price toward the $45,000 resistance.
Source: BTCUSD on TradingView.com
The next resistance is now forming near the $45,500 level. A close above the $45,500 level could push the price further higher. The next major resistance sits at $46,500.
If Bitcoin fails to rise above the $43,800 resistance zone, it could start a downside correction. Immediate support on the downside is near the $43,200 level.
The next major support is $42,500. The main support could be $42,200 and the trend line. If there is a close below $42,200, the price could gain bearish momentum. In the stated case, the price could dive toward the $40,650 support.
Technical indicators:
Hourly MACD – The MACD is now gaining pace in the bullish zone.
Hourly RSI (Relative Strength Index) – The RSI for BTC/USD is now above the 50 level.
Major Support Levels – $43,200, followed by $42,500.
Major Resistance Levels – $43,800, $44,500, and $45,000.
[#item_full_content]NewsBTCRead MoreBitcoin Magazine The Smarter Web Company’s UK IPO to Include Retail Access and Bitcoin Treasury…
Bitcoin (BTC) mining profitability fell 7.4% in March, investment bank Jefferies said in a research…
Crypto analyst Titan of Crypto has raised the possibility of the Bitcoin price rallying to…
Last week was defined by simultaneous declines in US equities, Treasurys, and the dollar—an exceptionally…
Bitcoin Magazine Bitcoin Miners Are Doubling Down With all the current bearish sentiment and macroeconomic…
Disclaimer: The analyst who wrote this piece owns shares of Strategy (MSTR). Strategy (MSTR) added…