Bitcoin Price Resumes Increase as Crypto Bulls Aim More Upsides
Bitcoin price extended its increase and traded towards $17,500. BTC is consolidating gains and might aim a move towards the $18,000 resistance.
Bitcoin extended its rise above the $17,200 and $17,250 resistance levels.
The price is trading above $17,200 and the 100 hourly simple moving average.
There is a major bullish trend line forming with support near $17,350 on the hourly chart of the BTC/USD pair (data feed from Kraken).
The pair could continue to move up towards the $18,000 resistance zone.
Bitcoin Price Gains Momentum
Bitcoin price settled above the key $17,000 pivot zone, opening the doors for more gains. BTC climbed further higher and was able to clear the $17,250 resistance zone.
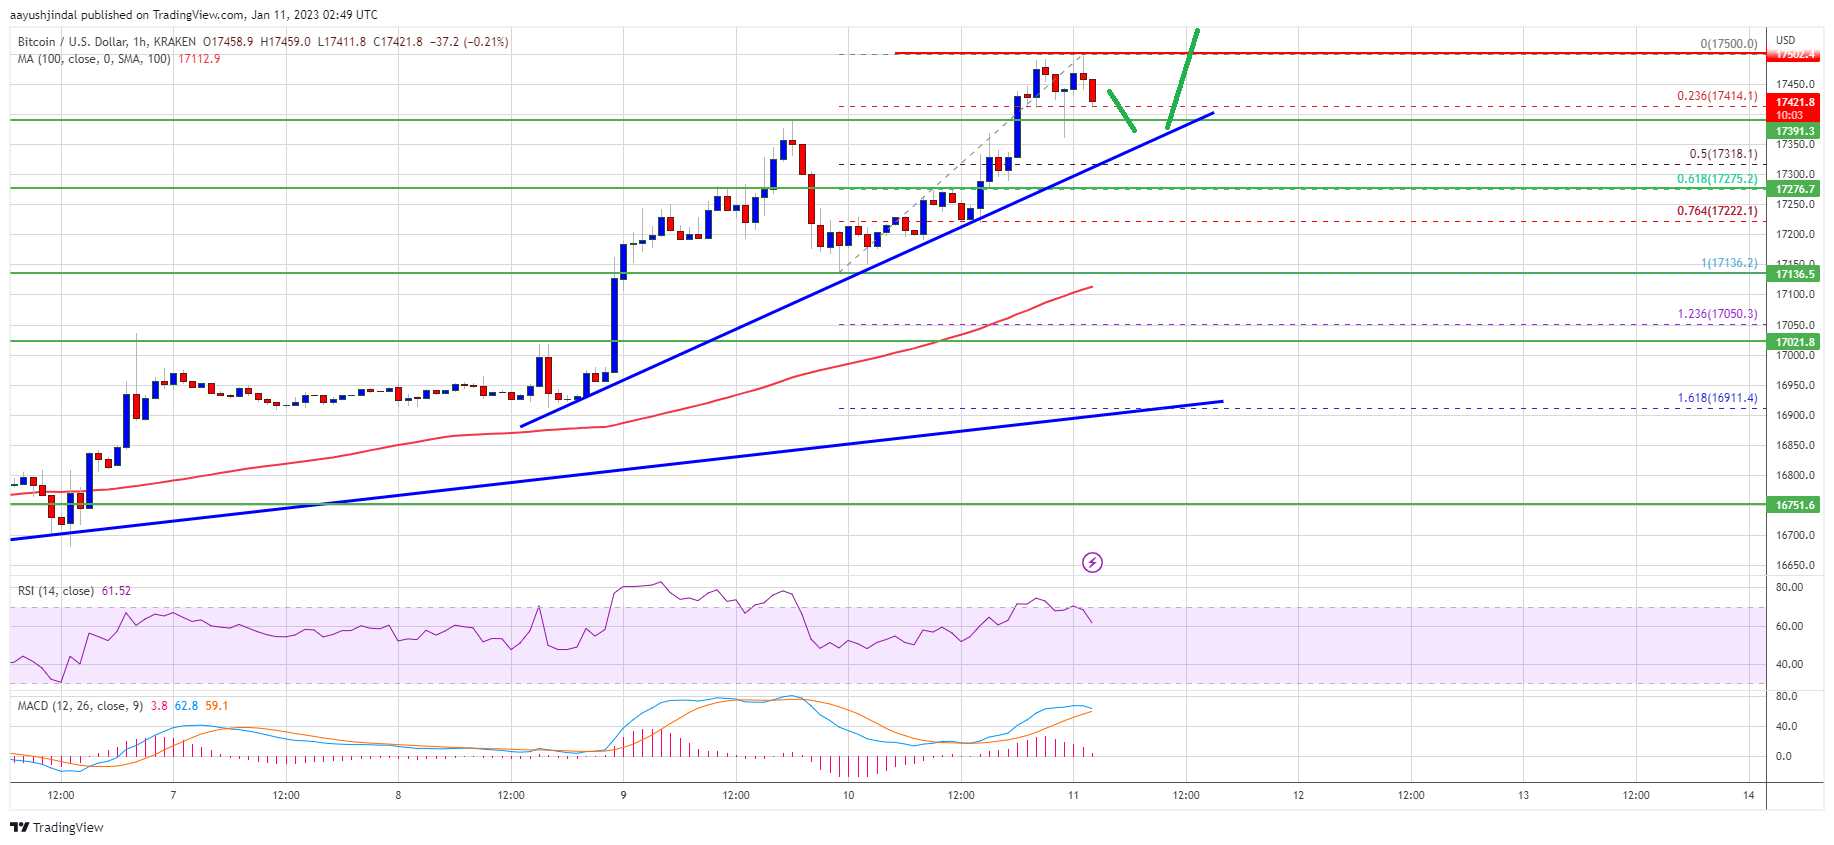
The price even broke the $17,400 resistance zone and tested the next barrier at $17,500. A high is formed near the $17,500 level the price is now consolidating gains. It is now testing the 23.6% Fib retracement level of the upward move from the $17,136 swing low to $17,500 high.
Bitcoin price is also trading above $17,200 and the 100 hourly simple moving average. Besides, there is a major bullish trend line forming with support near $17,350 on the hourly chart of the BTC/USD pair.
Source: BTCUSD on TradingView.com
On the upside, an immediate resistance is near the $17,500 level. The next major resistance is near the $18,000 zone, above which the price might accelerate higher. In the stated case, the price may perhaps rise towards the $18,500 level. Any more gains might send btc price towards the $19,200 level.
Dips Limited in BTC?
If bitcoin price fails to clear the $17,500 resistance, it could start a downside correction. An immediate support on the downside is near the $17,350 level and the trend line.
The next major support is near the $17,270 level. It is near the 61.8% Fib retracement level of the upward move from the $17,136 swing low to $17,500 high. The main support is now forming near the $17,130 level, below which the price might retest $16,800.
Technical indicators:
Hourly MACD – The MACD is now losing pace in the bullish zone.
Hourly RSI (Relative Strength Index) – The RSI for BTC/USD is now above the 50 level.
Major Support Levels – $17,350, followed by $17,130.
Major Resistance Levels – $17,500, $17,800 and $18,000.
Bitcoin price extended its increase and traded towards $17,500. BTC is consolidating gains and might aim a move towards the $18,000 resistance.
Bitcoin extended its rise above the $17,200 and $17,250 resistance levels.
The price is trading above $17,200 and the 100 hourly simple moving average.
There is a major bullish trend line forming with support near $17,350 on the hourly chart of the BTC/USD pair (data feed from Kraken).
The pair could continue to move up towards the $18,000 resistance zone.
Bitcoin Price Gains Momentum
Bitcoin price settled above the key $17,000 pivot zone, opening the doors for more gains. BTC climbed further higher and was able to clear the $17,250 resistance zone.
The price even broke the $17,400 resistance zone and tested the next barrier at $17,500. A high is formed near the $17,500 level the price is now consolidating gains. It is now testing the 23.6% Fib retracement level of the upward move from the $17,136 swing low to $17,500 high.
Bitcoin price is also trading above $17,200 and the 100 hourly simple moving average. Besides, there is a major bullish trend line forming with support near $17,350 on the hourly chart of the BTC/USD pair.
Source: BTCUSD on TradingView.com
On the upside, an immediate resistance is near the $17,500 level. The next major resistance is near the $18,000 zone, above which the price might accelerate higher. In the stated case, the price may perhaps rise towards the $18,500 level. Any more gains might send btc price towards the $19,200 level.
Dips Limited in BTC?
If bitcoin price fails to clear the $17,500 resistance, it could start a downside correction. An immediate support on the downside is near the $17,350 level and the trend line.
The next major support is near the $17,270 level. It is near the 61.8% Fib retracement level of the upward move from the $17,136 swing low to $17,500 high. The main support is now forming near the $17,130 level, below which the price might retest $16,800.
Technical indicators:
Hourly MACD – The MACD is now losing pace in the bullish zone.
Hourly RSI (Relative Strength Index) – The RSI for BTC/USD is now above the 50 level.
Major Support Levels – $17,350, followed by $17,130.
Major Resistance Levels – $17,500, $17,800 and $18,000.
Tags: bitcoinbitcoin pricebtcusdBTCUSDTxbtusd
NewsBTCRead More


Recent Posts
Bitcoin Eyes Record High Above $109K as U.S Reaches Trade Deal with China, Inflation Data Looms
Bitcoin BTC could soon hit record price highs, triggering accelerated gains in the wider altcoin…
Bitcoin Price Breakout Brewing: Is a Massive Rally Just Getting Started?
Bitcoin price started a fresh surge above the $102,000 zone. BTC is rising and might…
Bitcoin DeFi Security Improves as Rootstock Boosts Hashrate Share
Decentralized finance (DeFi) on the Bitcoin blockchain may still be in its infancy relative to…
Best Altcoins to Buy as Bitcoin Nears All-Time High After Progressive US-China Trade Talks
Bitcoin has successfully reclaimed the $100K mark and is now trading around $104K. This sharp…
Ethereum Surges Past $2,600: Popular Trader Says ETH Is Leaping Ahead Of Bitcoin
The price performance of Ethereum has been one of the most disappointing features of 2025,…
Bitcoin’s Quiet Coup: Wealth Funds Build Up Holdings
Sovereign wealth funds have begun to dabble in Bitcoin, but massive bets remain on hold.…