Bitcoin Price Retains Support: Is a Bounce Back on the Horizon?
Bitcoin price remained stable above the $58,500 support zone. BTC is struggling and could only start a steady increase if it clears $61,500.
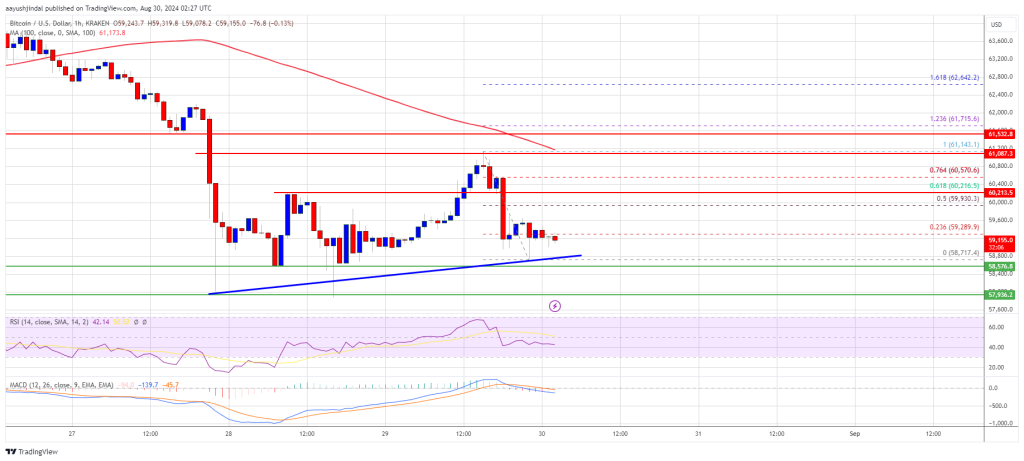
Bitcoin is struggling to rise above the $60,200 and $61,500 resistance levels.
The price is trading below $61,000 and the 100 hourly Simple moving average.
There is a connecting bullish trend line forming with support at $58,800 on the hourly chart of the BTC/USD pair (data feed from Kraken).
The pair might extend losses if it fails to stay above the $58,500 support.
Bitcoin Price Stuck In A Range
Bitcoin price remained stable above the $58,000 and $58,500 support levels. A base was formed, and the price attempted a recovery wave above the $59,500 level. However, the bears were active near the $61,200 level.
There was a fresh decline, and the price retested the $58,800 support. A low was formed at $58,717 and the price is now consolidating losses. It is stuck near the 23.6% Fib retracement level of the recent decline from the $61,143 swing high to the $58,717 low.
Bitcoin is now trading below $61,000 and the 100 hourly Simple moving average. There is also a connecting bullish trend line forming with support at $58,800 on the hourly chart of the BTC/USD pair.
On the upside, the price could face resistance near the $59,650 level. The first key resistance is near the $60,200 level. It is near the 61.8% Fib retracement level of the recent decline from the $61,143 swing high to the $58,717 low.
A clear move above the $60,200 resistance might send the price further higher in the coming sessions. The next key resistance could be $61,200. A close above the $61,200 resistance might spark more upsides. In the stated case, the price could rise and test the $62,500 resistance.
More Downsides In BTC?
If Bitcoin fails to rise above the $60,200 resistance zone, it could start another decline. Immediate support on the downside is near the $58,800 level and the trend line.
The first major support is $58,500. The next support is now near the $58,000 zone. Any more losses might send the price toward the $56,500 support in the near term.
Technical indicators:
Hourly MACD – The MACD is now losing pace in the bearish zone.
Hourly RSI (Relative Strength Index) – The RSI for BTC/USD is now below the 50 level.
Major Support Levels – $58,800, followed by $58,000.
Major Resistance Levels – $60,200, and $61,200.
[#item_full_content]NewsBTCRead More


Recent Posts
Tether May Have to Sell Some Bitcoin to Comply With U.S. Stablecoin Rules: JPMorgan
USDT issuer Tether could face challenges if proposed U.S. stablecoin regulation is passed, and the…
El Salvador Dispatch: Searching for Bitcoin City, the Modern El Dorado
This article is part of a four-piece series on El Salvador. You can find the…
Peter Thiel-Backed Plasma Raises $20M to Develop Bitcoin-Based Network for Stablecoins
Plasma, a crypto startup building a Bitcoin-based blockchain designed specifically for stablecoins, raised $20 million…
Bitcoin To $1.5 Million? Ark Invest CEO Cathie Wood Says It’s Coming
ARK Invest’s Cathie Wood is steadfast on her estimate that Bitcoin may rise to $1.5…
Bitcoin Dips Below $95K as January CPI Data Shows Increasing Inflation. Can $MEMEX 100x?
The January US CPI data is in, and it’s not what the market anticipated. Consumer…
U.S. Bitcoin ETFs See Third Straight Day of Outflows, Totaling $494M, as BTC Stalls
U.S. spot-listed bitcoin (BTC) exchange-traded funds (ETFs) have seen three consecutive days of outflows totaling…