Bitcoin price trimmed all losses and climbed above $37,000. BTC is now eyeing a major upside break above the $37,750 and $38,000 resistance levels.
Bitcoin is showing positive signs and testing the $37,750 resistance.
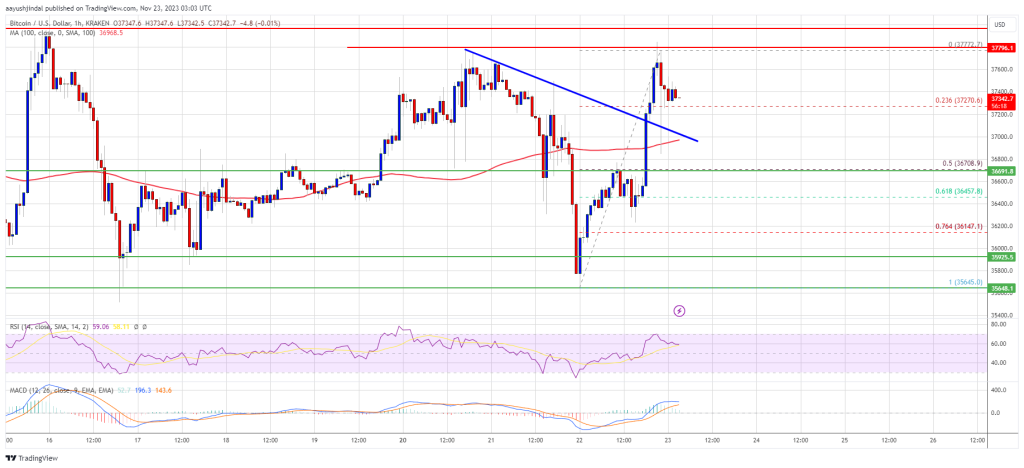
The price is trading above $37,000 and the 100 hourly Simple moving average.
There was a break above a major bearish trend line with resistance near $37,150 on the hourly chart of the BTC/USD pair (data feed from Kraken).
The pair could start a major increase if it clears the $38,000 resistance zone.
Bitcoin price started a downside correction after reports of Binance’s settlement and CZ stepping down. BTC dropped below the $37,000 support. However, the bulls were active near the $35,650 support zone.
A low was formed near $35,645 and the price started a fresh increase. It trimmed all losses and climbed above the $37,000 resistance. There was a break above a major bearish trend line with resistance near $37,150 on the hourly chart of the BTC/USD pair.
The pair even broke the $37,500 level and tested the key hurdle at $37,750. Bitcoin is now trading above $37,000 and the 100 hourly Simple moving average. It is also above the 23.6% Fib retracement level of the upward move from the $35,645 swing low to the $37,777 high.
On the upside, immediate resistance is near the $37,750 level. The main resistance is now forming near the $38,000 level. A close above the $38,0000 resistance might start a strong increase.
Source: BTCUSD on TradingView.com
The next key resistance could be near $38,800. A clear move above the $38,800 resistance could send the price further higher toward the $39,200 level. In the stated case, it could even test the $40,000 resistance.
If Bitcoin fails to rise above the $37,750 resistance zone, it could start a fresh decline. Immediate support on the downside is near the $37,150 level.
The next major support is $36,700 or the 50% Fib retracement level of the upward move from the $35,645 swing low to the $37,777 high. If there is a move below $36,700, there is a risk of more downsides. In the stated case, the price could drop toward the $36,150 support in the near term. The next key support or target could be $35,650.
Technical indicators:
Hourly MACD – The MACD is now losing pace in the bullish zone.
Hourly RSI (Relative Strength Index) – The RSI for BTC/USD is now above the 50 level.
Major Support Levels – $36,700, followed by $35,650.
Major Resistance Levels – $37,750, $38,000, and $38,800.
[#item_full_content]NewsBTCRead MoreBitcoin price failed to gain pace for a move above the $100,000 zone. BTC again…
Bitcoin’s price rally may be under threat as it continues to trade under $100,000. According…
A new technical analysis on TradingView suggests Bitcoin may be approaching a decisive moment, with…
The Bitcoin market continued to struggle in February marked by a high level of investor…
Bitcoin has experienced a tiring price action in recent weeks, with the price struggling to…
A former cryptocurrency exchange executive remarked that Bitcoin is an inescapable reality, a statement that…