Bitcoin Price Sees Technical Correction But The Bulls Are Not Done Yet
Bitcoin price extended its increase toward the $28,500 resistance. BTC corrected gains and is currently holding a key support at $27,350.
Bitcoin climbed further higher above the $28,000 and $28,200 resistance levels.
The price is trading above $27,400 and the 100 hourly Simple moving average.
There is a major bullish trend line forming with support near $27,400 on the hourly chart of the BTC/USD pair (data feed from Kraken).
The pair could start another increase unless there is a move below the $26,650 support.
Bitcoin Price Remains Supported
Bitcoin price started a decent increase above the $27,200 resistance zone. BTC climbed higher steadily above the $27,500 and $28,000 resistance levels.
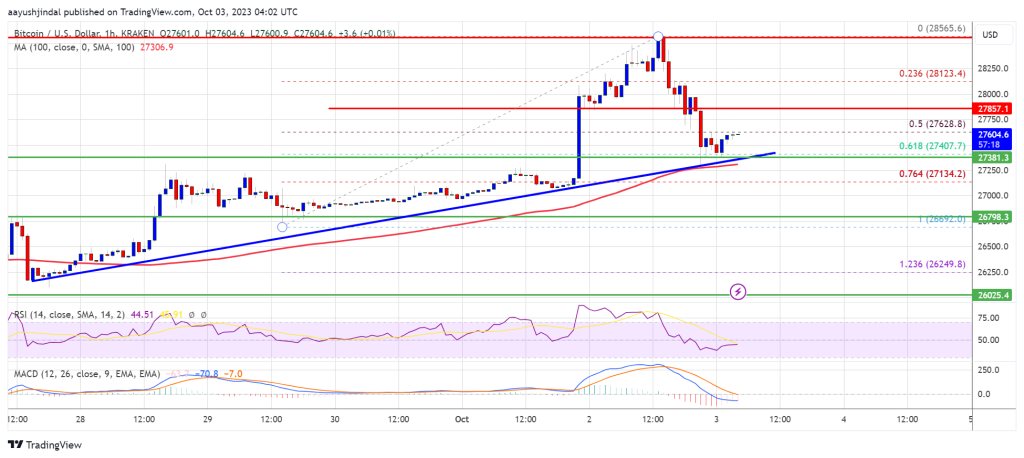
The price tested the $28,500 resistance. A new multi-week high was formed near $28,565 before it saw a downside correction. Finally, the price saw a downside correction below the $28,200 and $28,000 levels. It even moved below the 50% Fib retracement level of the upward move from the $26,690 swing low to the $28,565 high.
Bitcoin is still trading above $27,400 and the 100 hourly Simple moving average. Besides, there is a major bullish trend line forming with support near $27,400 on the hourly chart of the BTC/USD pair.
Immediate resistance on the upside is near the $27,850 level. The next key resistance could be near the $28,000 level. A close above the $28,000 resistance could start another increase.
Source: BTCUSD on TradingView.com
In the stated case, the price could climb toward the $28,500 resistance. Any more gains might call for a move toward the $29,200 level.
More Losses In BTC?
If Bitcoin fails to continue higher above the $28,000 resistance, there could be more downsides. Immediate support on the downside is near the $27,400 level and the trend line.
The next major support is near the $27,250 level or the 100 SMA. A downside break and close below the $27,250 level might send the price toward $26,800. The next support sits at $26,650. Any more losses might call for a test of $26,000.
Technical indicators:
Hourly MACD – The MACD is now losing pace in the bullish zone.
Hourly RSI (Relative Strength Index) – The RSI for BTC/USD is now below the 50 level.
Major Support Levels – $27,250, followed by $26,650.
Major Resistance Levels – $28,000, $28,500, and $29,200.
[#item_full_content]NewsBTCRead More


Recent Posts
Michael Saylor’s $84 Billion Bitcoin Bet: How Is Strategy Doing On Its Current BTC Holdings?
Michael Saylor’s Bitcoin-first investment strategy has once again taken the spotlight after Strategy (formerly MicroStrategy)…
Bitcoin At Critical Juncture – Price Levels To Watch: Analyst
Bitcoin maintains its bullish form from April as it gains by over 4% in the…
Analyst Says Bitcoin’s Most Crucial Support Level Is At $91,200 — What’s Next?
The price of Bitcoin has started the month of May with a similar bullish impetus…
Bitcoin Price Trading Within Dense Supply Cluster — What Lies Beyond $100K?
After two weeks of strong action, the Bitcoin price seems to be back on the…
Bitcoin To Infinity? Venture Capitalist Says Crypto’s Value Vs. Dollar Has No Ceiling
The dollar is weakening this year. As reported, the US dollar index declined 7% year-to-date,…
Arizona Governor Calls Crypto an ‘Untested Investment,’ Vetoes Bitcoin Reserve Bill
Arizona will not be investing in bitcoin (BTC), at least not this year. Governor Katie…