Bitcoin Price Sees Wild Swing Moves, Uptrend To Extend Toward $70K?
Bitcoin price rallied further above $62,000. BTC is now consolidating gains and might soon attempt another upward move toward the $64,000 resistance.
Bitcoin price is consolidating gains below the $60,000 resistance zone.
The price is trading above $60,500 and the 100 hourly Simple moving average.
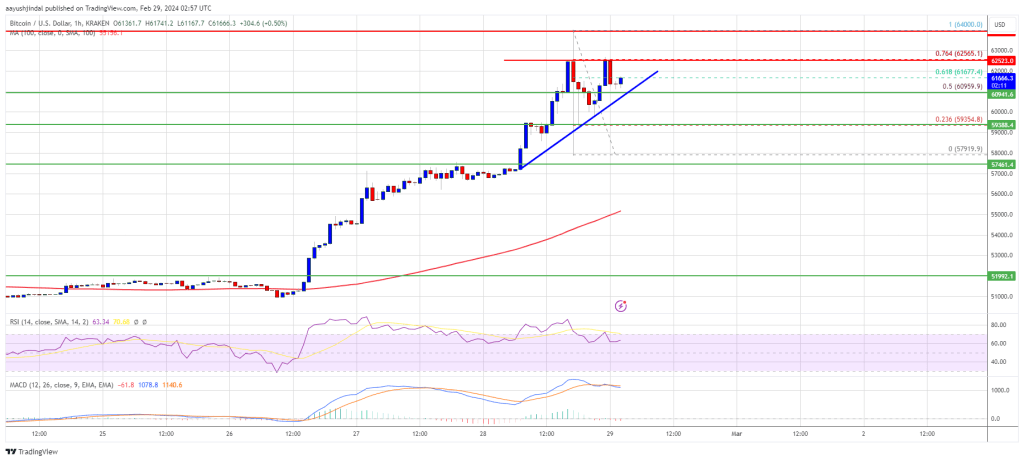
There is a connecting bullish trend line forming with support at $60,950 on the hourly chart of the BTC/USD pair (data feed from Kraken).
The pair could extend its current rally toward the $64,000 resistance zone.
Bitcoin Price Jumps Over $5K
Bitcoin price remained strong above the $58,000 resistance zone. BTC formed a fresh support base and started another rally. It gained over 10% and broke many hurdles near $60,000 and $62,000.
The price even surged toward the $64,000 level. A new multi-week high was formed near $64,000 before there was a sharp decline after the Coinbase outage. The price dived toward the $58,000 support zone. A low was formed near $57,919 and the price started a fresh rally.
It is back above the $60,000 resistance. There was a move above the 50% Fib retracement level of the downward move from the $64,000 swing high to the $57,919 low.
Bitcoin is now trading above $60,000 and the 100 hourly Simple moving average. There is also a connecting bullish trend line forming with support at $60,950 on the hourly chart of the BTC/USD pair. Immediate resistance is near the $62,500 level. It is near the 76.4% Fib retracement level of the downward move from the $64,000 swing high to the $57,919 low.
Source: BTCUSD on TradingView.com
The next key resistance could be $64,000, above which the price could rise toward the $65,000 resistance zone. If the bulls remain in action, the price could even surpass $65,000 and test $66,400. The main hurdle for them is visible near the $68,000 zone.
Are Dips Supported In BTC?
If Bitcoin fails to rise above the $62,500 resistance zone, it could start a downside correction. Immediate support on the downside is near the $60,800 level and the trend line.
The first major support is $60,000. If there is a close below $60,000, the price could start a decent pullback toward the $58,000 zone. Any more losses might send the price toward the $56,500 support zone.
Technical indicators:
Hourly MACD – The MACD is now gaining pace in the bullish zone.
Hourly RSI (Relative Strength Index) – The RSI for BTC/USD is now above the 50 level.
Major Support Levels – $60,800, followed by $60,000.
Major Resistance Levels – $62,500, $64,000, and $65,000.
[#item_full_content]NewsBTCRead More


Recent Posts
Bitcoin Banks: We Should Build Them Ourselves
Bitcoin banks are going to happen. We already have a few of them. We’re going…
Did A Massive Bitcoin And Ethereum Sell-Off By Binance Trigger The Market Crash? Crypto Exchange Responds
There have been recent concerns within the crypto community regarding Binance’s recent activities after a…
Bitcoin In The Spotlight As World Liberty Financial Debuts Strategic Reserve
By launching its Macro Strategic Reserve, World Liberty Financial (WLFI) has advanced significantly and strengthened…
Bitcoin Finds Price Stability: Reclaiming $101,000 Depends On This Level
Bitcoin (BTC) continues to move within its one-week range after recovering from its recent drop…
US to Release Jailed BTC-e Operator Vinnik in Russia Prisoner Swap
Alexander Vinnik, the jailed former operator of once mighty bitcoin exchange BTC-e, is being released…
Galoy Launches Bitcoin-Backed Loan Software, Sets Groundwork For Open-Source Banking
Founder: Nicolas Burtey Date Founded: September 2019 Location of Headquarters: United States Number of Employees:…