Bitcoin price again failed to clear the $38,000 resistance zone. BTC is likely forming a double top and might decline toward the $34,500 support.
Bitcoin started a fresh decline from the $38,000 resistance zone.
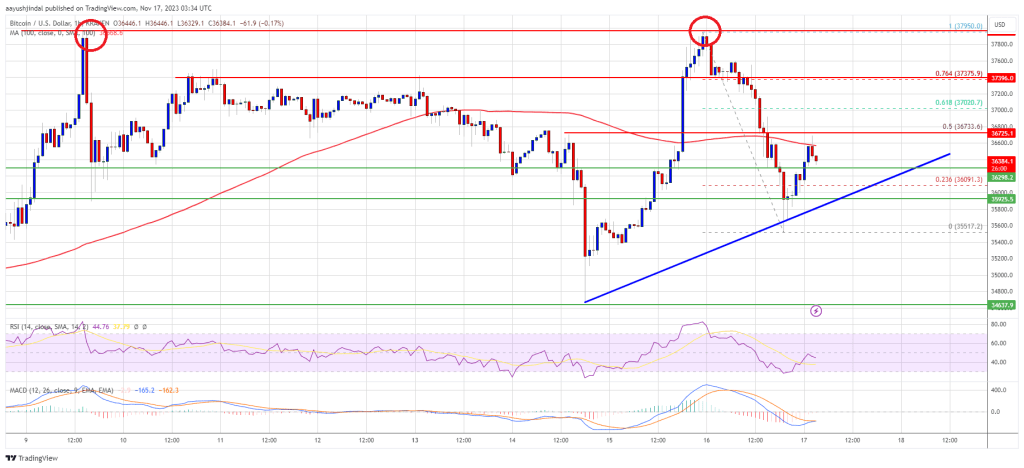
The price is trading below $36,750 and the 100 hourly Simple moving average.
There is a connecting bullish trend line forming with support near $36,250 on the hourly chart of the BTC/USD pair (data feed from Kraken).
The pair could decline further if there is a break below the $35,950 support.
Bitcoin price made another attempt to clear the $38,000 resistance. However, BTC failed to clear the $38,000 resistance and started a fresh decline. It seems like the price is forming a double-top pattern near the $38,000 zone.
There was a sharp move below the $37,200 and $37,000 levels. The price even spiked below the $36,500 level and the 100 hourly Simple moving average. Finally, the bulls appeared near the $35,500 level. A low was formed near $35,517 and the price is now correcting losses.
The price climbed above the 23.6% Fib retracement level of the downward move from the $37,950 swing high to the $35,517 low. Bitcoin is now trading below $36,750 and the 100 hourly Simple moving average. There is also a connecting bullish trend line forming with support near $36,250 on the hourly chart of the BTC/USD pair.
On the upside, immediate resistance is near the $36,700 level. The next key resistance could be near $37,000 or 61.8% Fib retracement level of the downward move from the $37,950 swing high to the $35,517 low.
Source: BTCUSD on TradingView.com
A close above the $37,000 resistance could start a strong increase. The first major resistance is near $37,500, above which the price might accelerate further higher. In the stated case, it could test the $38,000 level. Any more gains might send BTC toward the $39,200 level.
If Bitcoin fails to rise above the $37,000 resistance zone, it could continue to move down to complete the double-top pattern. Immediate support on the downside is near the $36,200 level.
The next major support is $36,000. If there is a move below $36,000, there is a risk of more downsides. In the stated case, the price could drop toward the $35,500 support in the near term. The next key support or target could be $34,500.
Technical indicators:
Hourly MACD – The MACD is now losing pace in the bullish zone.
Hourly RSI (Relative Strength Index) – The RSI for BTC/USD is now below the 50 level.
Major Support Levels – $36,200, followed by $35,500.
Major Resistance Levels – $36,700, $37,000, and $38,000.
[#item_full_content]NewsBTCRead MoreBitcoin Magazine The University of Austin (UATX) Partners with the Texas Bitcoin Foundation, Bitcoin Policy…
Bitcoin Magazine Voltage Aims To Bring Bitcoin’s Lightning Network To Every Business In The World…
Bitcoin Magazine How Local Businesses Can Use Bitcoin For Payments I. Introduction Bitcoin is often…
Bitcoin Magazine Bitcoin Price Set for Big Move as Volatility Drops Bitcoin appears to be…
Bitcoin Magazine FPPS Is Not A Free Lunch For Bitcoin Miners Bitcoin mining is a…
Bitcoin Magazine Conference Bitcoin Afrique: A Bitcoin-Only Revolution in French-Speaking Africa In April 2025, Bitcoiners…