Bitcoin price gained over 8% and surged above $70,000. BTC is now consolidating gains and showing signs of more upsides in the near term.
Bitcoin started a fresh increase above the $70,000 resistance zone.
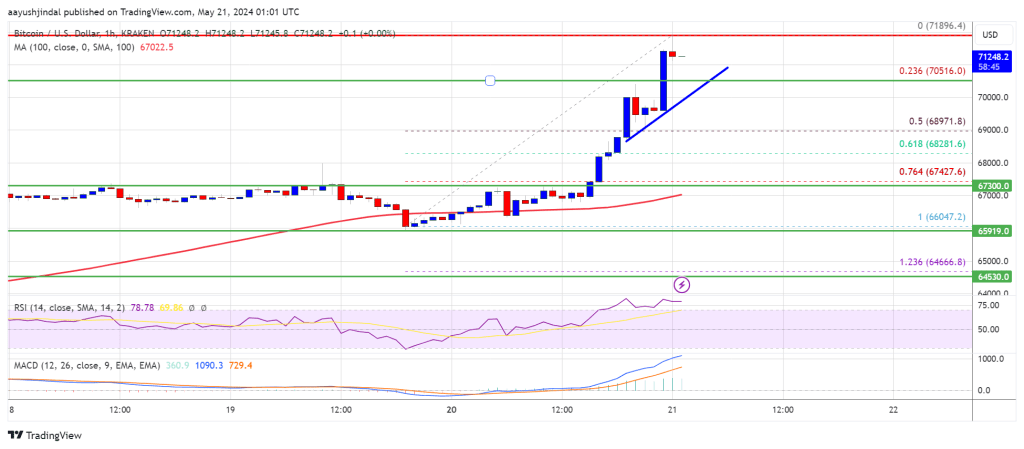
The price is trading above $79,000 and the 100 hourly Simple moving average.
There is a connecting bullish trend line forming with support at $70,500 on the hourly chart of the BTC/USD pair (data feed from Kraken).
The pair could start another increase unless the bears push it below $68,800.
Bitcoin price formed a base above the $66,500 level. BTC started a fresh increase above the $68,000 resistance zone after Ethereum rallied above $3,200.
There was a strong move above the $70,000 resistance zone. The price gained over 8% and even tested the $72,000 resistance zone. A new weekly high was formed at $71,896 and the price is now consolidating gains.
The price is well above the 23.6% Fib retracement level of the upward move from the $66,047 swing low to the $71,896 high. Bitcoin is also trading above $79,000 and the 100 hourly Simple moving average. Besides, there is a connecting bullish trend line forming with support at $70,500 on the hourly chart of the BTC/USD pair.
The price is now facing resistance near the $71,850 level. The first major resistance could be $72,000. The next key resistance could be $72,500. A clear move above the $72,500 resistance might send the price higher. In the stated case, the price could rise and test the $73,200 resistance.
If the bulls remain in action, the price could rise toward the $74,400 resistance zone. Any more gains might send BTC toward the $75,000 barrier.
If Bitcoin fails to climb above the $72,000 resistance zone, it could start a downside correction. Immediate support on the downside is near the $70,500 level and the trend line.
The first major support is $70,000. The main support is now forming near $68,850 or the 50% Fib retracement level of the upward move from the $66,047 swing low to the $71,896 high. Any more losses might send the price toward the $67,450 support zone in the near term.
Technical indicators:
Hourly MACD – The MACD is now gaining pace in the bullish zone.
Hourly RSI (Relative Strength Index) – The RSI for BTC/USD is now above the 70 level.
Major Support Levels – $70,500, followed by $70,000.
Major Resistance Levels – $71,850, $72,000, and $72,500.
[#item_full_content]NewsBTCRead MoreBitcoin is experiencing a challenging period, with its price remaining below the $100,000 mark after…
According to a recent CryptoQuant Research post, Bitcoin (BTC) network activity has slumped to a…
Bitcoin price is consolidating above the $95,500 support zone. BTC is showing a few positive…
Bitcoin continued dominance has remained a defining feature of the current market cycle, with the…
Follow Frank on X. Over the course of the last week, we’ve seen reports of…
Recently, Flashnet announced that it had raised a $4.5m seed round, led by Abstract Ventures with…