Bitcoin price climbed further higher above $18,500. BTC tested the $19,000 resistance zone and is currently consolidating gains.
Bitcoin climbed further higher above the $18,000 and $18,500 resistance levels.
The price is trading above $18,200 and the 100 hourly simple moving average.
There is a connecting bullish trend line forming with support near $18,600 on the hourly chart of the BTC/USD pair (data feed from Kraken).
The pair could correct lower towards the $18,500 and $18,350 support levels.
Bitcoin price remained well bid above the $18,000 zone. BTC formed another bullish breakout and was able to surge above the $18,500 resistance zone, unlike ethereum.
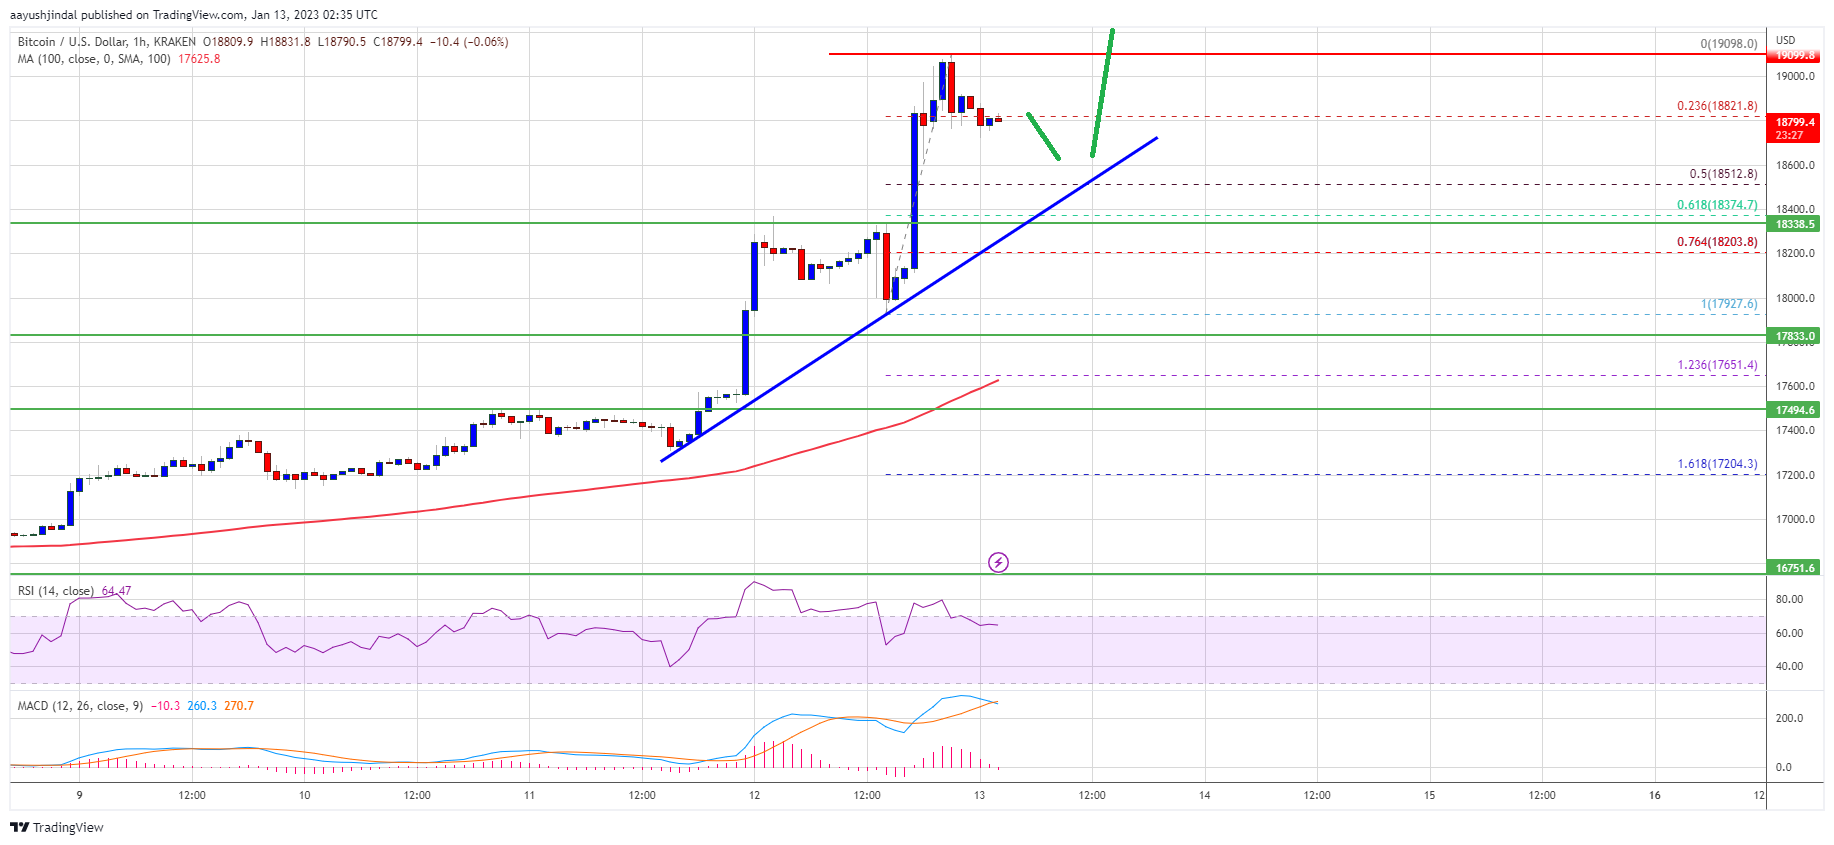
The price cleared the $18,800 resistance zone and even spiked above the $19,000 level. A high is formed near $19,098 and the price is now consolidating gains. There was a minor decline below the $18,900 level. The price declined below the 23.6% Fib retracement level of the upward move from the $17,927 swing low to $19,098 high.
Bitcoin price is trading above $18,200 and the 100 hourly simple moving average. There is also a connecting bullish trend line forming with support near $18,600 on the hourly chart of the BTC/USD pair.
Source: BTCUSD on TradingView.com
On the upside, an immediate resistance is near the $19,000 level. The next major resistance is near the $19,200 zone, above which the price might start another steady increase. In the stated case, the price may perhaps rise towards the $19,500 level. Any more gains might send btc price towards the $20,000 level.
If bitcoin price fails to clear the $19,000 resistance, it could start a downside correction. An immediate support on the downside is near the $18,650 level.
The next major support is near the $18,500 level and the trend line. It is near the 50% Fib retracement level of the upward move from the $17,927 swing low to $19,098 high. The main support is now forming near the $17,800 level, below which the price might retest $17,000.
Technical indicators:
Hourly MACD – The MACD is now losing pace in the bullish zone.
Hourly RSI (Relative Strength Index) – The RSI for BTC/USD is now above the 50 level.
Major Support Levels – $18,650, followed by $18,500.
Major Resistance Levels – $19,000, $19,200 and $20,000.
Bitcoin price climbed further higher above $18,500. BTC tested the $19,000 resistance zone and is currently consolidating gains.
Bitcoin climbed further higher above the $18,000 and $18,500 resistance levels.
The price is trading above $18,200 and the 100 hourly simple moving average.
There is a connecting bullish trend line forming with support near $18,600 on the hourly chart of the BTC/USD pair (data feed from Kraken).
The pair could correct lower towards the $18,500 and $18,350 support levels.
Bitcoin price remained well bid above the $18,000 zone. BTC formed another bullish breakout and was able to surge above the $18,500 resistance zone, unlike ethereum.
The price cleared the $18,800 resistance zone and even spiked above the $19,000 level. A high is formed near $19,098 and the price is now consolidating gains. There was a minor decline below the $18,900 level. The price declined below the 23.6% Fib retracement level of the upward move from the $17,927 swing low to $19,098 high.
Bitcoin price is trading above $18,200 and the 100 hourly simple moving average. There is also a connecting bullish trend line forming with support near $18,600 on the hourly chart of the BTC/USD pair.
Source: BTCUSD on TradingView.com
On the upside, an immediate resistance is near the $19,000 level. The next major resistance is near the $19,200 zone, above which the price might start another steady increase. In the stated case, the price may perhaps rise towards the $19,500 level. Any more gains might send btc price towards the $20,000 level.
If bitcoin price fails to clear the $19,000 resistance, it could start a downside correction. An immediate support on the downside is near the $18,650 level.
The next major support is near the $18,500 level and the trend line. It is near the 50% Fib retracement level of the upward move from the $17,927 swing low to $19,098 high. The main support is now forming near the $17,800 level, below which the price might retest $17,000.
Technical indicators:
Hourly MACD – The MACD is now losing pace in the bullish zone.
Hourly RSI (Relative Strength Index) – The RSI for BTC/USD is now above the 50 level.
Major Support Levels – $18,650, followed by $18,500.
Major Resistance Levels – $19,000, $19,200 and $20,000.
Tags: bitcoinbitcoin pricebtcusdBTCUSDTxbtusd
NewsBTCRead More
Bitcoin Magazine How Local Businesses Can Use Bitcoin For Payments I. Introduction Bitcoin is often…
Bitcoin Magazine Bitcoin Price Set for Big Move as Volatility Drops Bitcoin appears to be…
Bitcoin Magazine FPPS Is Not A Free Lunch For Bitcoin Miners Bitcoin mining is a…
Bitcoin Magazine Conference Bitcoin Afrique: A Bitcoin-Only Revolution in French-Speaking Africa In April 2025, Bitcoiners…
Matt Cole, CEO of Strive Asset Management—an investment firm co-founded by Vivek Ramaswamy—has urged GameStop…
"I wouldn't even be in this situation if it wasn't for you. You brought down…