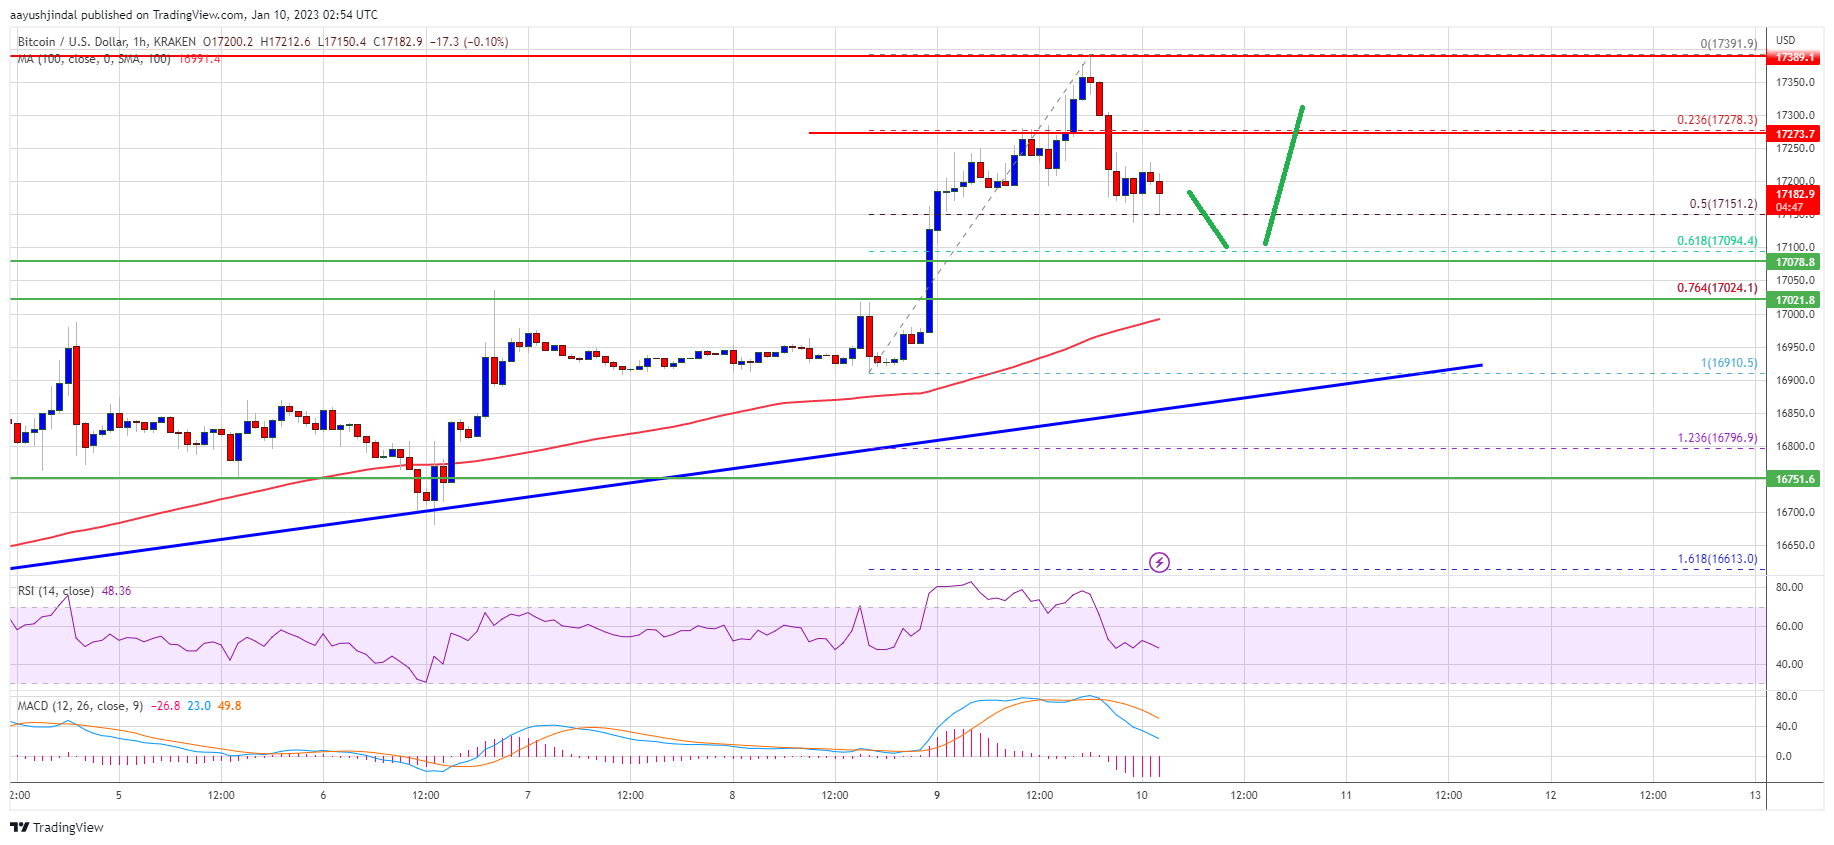
Bitcoin price extended its rise and traded towards $17,400. BTC is correcting gains, but it remains well supported near the $17,000 zone.
Bitcoin extended its increase above the $17,000 and $17,200 resistance levels.
The price is trading above $17,000 and the 100 hourly simple moving average.
There is a key bullish trend line forming with support near $16,880 on the hourly chart of the BTC/USD pair (data feed from Kraken).
The pair could rise further if it stays above the $17,000 support and the trend line.
Bitcoin price remained in a positive zone above the $16,800 level. BTC extended its increase after there was a clear close above the $17,000 level and the 100 hourly simple moving average.
The price gained pace and traded above the $17,250 level. It traded to a new yearly high at $17,391 before the bears appeared. There was a minor downside correction below the $17,250 level. It is now trading near the 50% Fib retracement level of the upward wave from the $16,911 swing low to $17,391 high.
Bitcoin price is now trading above $17,000 and the 100 hourly simple moving average. There is also a key bullish trend line forming with support near $16,880 on the hourly chart of the BTC/USD pair.
Source: BTCUSD on TradingView.com
On the upside, an immediate resistance is near the $17,280 level. The next major resistance is near the $17,400 zone, above which the price might even clear the $17,500 resistance. In the stated case, the price may perhaps rise towards the $18,000 level. Any more gains might send btc price towards the $18,500 level.
If bitcoin price fails to clear the $17,300 resistance, it could extend its downside correction. An immediate support on the downside is near the $17,150 level.
The next major support is near the $17,080 level. It is near the 61.8% Fib retracement level of the upward wave from the $16,911 swing low to $17,391 high. The main support is now forming near the $17,000 zone and the trend line region, below which the price might retest $16,500.
Technical indicators:
Hourly MACD – The MACD is now losing pace in the bullish zone.
Hourly RSI (Relative Strength Index) – The RSI for BTC/USD is now above the 50 level.
Major Support Levels – $17,150, followed by $17,000.
Major Resistance Levels – $17,300, $17,400 and $18,000.
Tags: bitcoinbitcoin pricebtcusdBTCUSDTxbtusd
NewsBTCRead More
Cathie Wood's investment management company ARK Invest snapped up $8.7 million of Coinbase (COIN) shares…
Bitcoin has seen a crash to the $87,000 level in the past day, but if…
The GitHub code you use to build a trendy application or patch existing bugs might…
Bitcoin’s price has continued its decline, dropping below several key levels in recent days. As…
Bitcoin (BTC) neared $89,000 in Asian morning hours after a 24-hour low of $86,200, slightly…
Tuesday was a rough day for the crypto market, as bitcoin (BTC) fell to three-month…