Bitcoin Price Stuck In Crucial Range, 2023 Breakout Looms
Bitcoin price is still trading in a range below the $17,000 resistance. BTC could witness a major breakout as we approach the New Year 2023.
Bitcoin failed to clear the $17,000 and $17,200 resistance levels.
The price is trading below $16,800 and the 100 hourly simple moving average.
There was a break below a major bullish trend line with support near $16,840 on the hourly chart of the BTC/USD pair (data feed from Kraken).
The pair could decline further if there is a clear move below the $16,550 support zone.
Bitcoin Price Revisits Support
Bitcoin price made another attempt to clear the $17,000 resistance zone. However, BTC struggled to gain pace for a clear move above the $17,000 level.
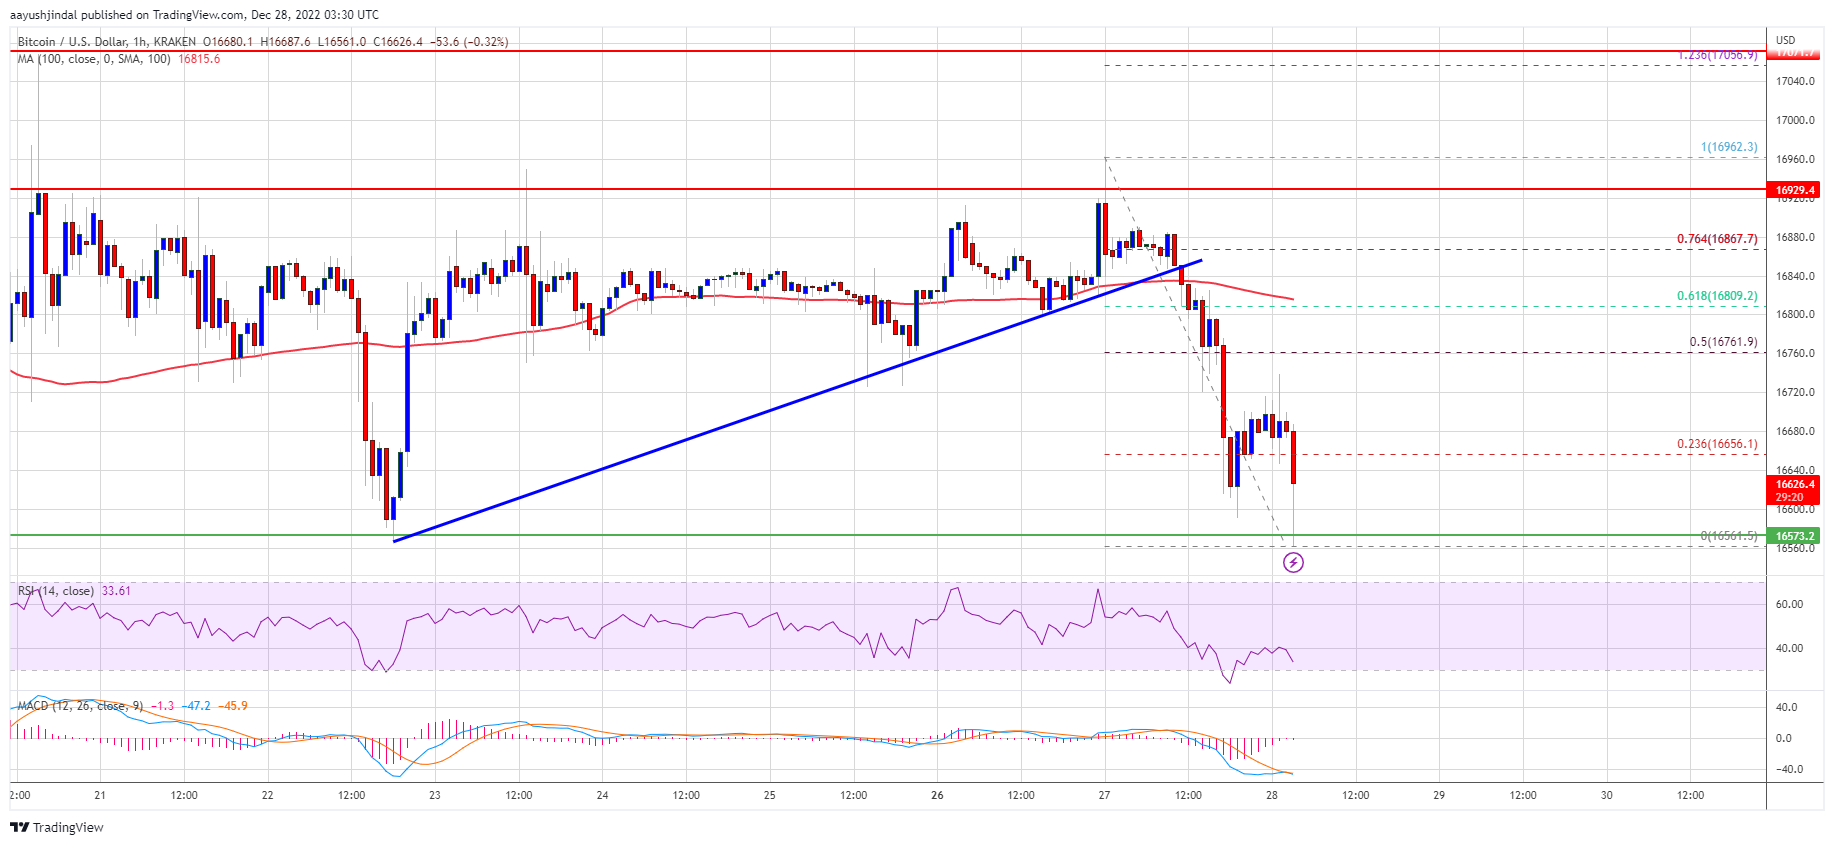
A high was formed near $16,962 before the price started a fresh decline. There was a clear move below the $16,800 support zone and the 100 hourly simple moving average. Besides, there was a break below a major bullish trend line with support near $16,840 on the hourly chart of the BTC/USD pair.
Bitcoin price tested the key $16,550 support zone. A low is formed near $16,561 and the price is now consolidating losses. It tested the 23.6% Fib retracement level of the downward move from the $16,962 swing high to $16,561 low.
On the upside, an immediate resistance is near the $16,720 zone. The first major resistance is near the $16,800 zone and the 100 hourly SMA. It is close to the 61.8% Fib retracement level of the downward move from the $16,962 swing high to $16,561 low.
Source: BTCUSD on TradingView.com
The main barrier is still near the $17,000 level. A clear move above the $17,000 resistance might start a steady recovery wave. The next major resistance is near $17,200, above which the price rise towards the $17,500 resistance zone. Any more gains might spark a move towards the $18,000 resistance zone.
More Losses in BTC?
If bitcoin fails to clear the $16,800 resistance, it could continue to move down. An immediate support on the downside is near the $16,550 level.
The next major support is near the $16,350 level. A downside break below the $16,350 support might send the pair towards the $16,000 level. Any more losses might send the price towards $15,550.
Technical indicators:
Hourly MACD – The MACD is now losing pace in the bearish zone.
Hourly RSI (Relative Strength Index) – The RSI for BTC/USD is now below the 50 level.
Major Support Levels – $16,550, followed by $16,350.
Major Resistance Levels – $16,800, $17,000 and $17,200.
Bitcoin price is still trading in a range below the $17,000 resistance. BTC could witness a major breakout as we approach the New Year 2023.
Bitcoin failed to clear the $17,000 and $17,200 resistance levels.
The price is trading below $16,800 and the 100 hourly simple moving average.
There was a break below a major bullish trend line with support near $16,840 on the hourly chart of the BTC/USD pair (data feed from Kraken).
The pair could decline further if there is a clear move below the $16,550 support zone.
Bitcoin Price Revisits Support
Bitcoin price made another attempt to clear the $17,000 resistance zone. However, BTC struggled to gain pace for a clear move above the $17,000 level.
A high was formed near $16,962 before the price started a fresh decline. There was a clear move below the $16,800 support zone and the 100 hourly simple moving average. Besides, there was a break below a major bullish trend line with support near $16,840 on the hourly chart of the BTC/USD pair.
Bitcoin price tested the key $16,550 support zone. A low is formed near $16,561 and the price is now consolidating losses. It tested the 23.6% Fib retracement level of the downward move from the $16,962 swing high to $16,561 low.
On the upside, an immediate resistance is near the $16,720 zone. The first major resistance is near the $16,800 zone and the 100 hourly SMA. It is close to the 61.8% Fib retracement level of the downward move from the $16,962 swing high to $16,561 low.
Source: BTCUSD on TradingView.com
The main barrier is still near the $17,000 level. A clear move above the $17,000 resistance might start a steady recovery wave. The next major resistance is near $17,200, above which the price rise towards the $17,500 resistance zone. Any more gains might spark a move towards the $18,000 resistance zone.
More Losses in BTC?
If bitcoin fails to clear the $16,800 resistance, it could continue to move down. An immediate support on the downside is near the $16,550 level.
The next major support is near the $16,350 level. A downside break below the $16,350 support might send the pair towards the $16,000 level. Any more losses might send the price towards $15,550.
Technical indicators:
Hourly MACD – The MACD is now losing pace in the bearish zone.
Hourly RSI (Relative Strength Index) – The RSI for BTC/USD is now below the 50 level.
Major Support Levels – $16,550, followed by $16,350.
Major Resistance Levels – $16,800, $17,000 and $17,200.
Tags: bitcoinbitcoin pricebtcusdBTCUSDTxbtusd
NewsBTCRead More


Recent Posts
Bitcoin to See Additional $330B of Corporate Treasury Inflows by 2029: Bernstein
Corporate treasury buying of bitcoin (BTC) could reach $330 billion by the end of 2029,…
Bitcoin Could Slide to $90K as BTC Traders Eye Fed Meeting
Bitcoin (BTC) slipped below $95,000 on Monday, with traders now eyeing a possible retreat to…
Bitcoin’s Support at $88.8K in Focus After Trendline Break; XRP Eyes Death Cross: Technical Analysis
This is a daily technical analysis by CoinDesk analyst and Chartered Market Technician Omkar Godbole.…
Bitcoin Treasury Firms’ ‘Dry Powder’ Could Push Prices Up Significantly: NYDIG
Bitcoin-holding public companies may be sitting on a powerful market catalyst: untapped issuance capacity that…
Bitcoin Faces Political Headwinds Even as the Best Presales Keep Finding Investors
The close of last week coughed up some rather unpleasant news for Bitcoin (and crypto)…
Strategy Buys $180 Million Worth of Bitcoin
Bitcoin Magazine Strategy Buys $180 Million Worth of Bitcoin According to a Monday SEC filing,…