Bitcoin price failed to clear the $61,500 resistance zone. BTC is now retesting the $58,000 support and might attempt a fresh increase.
Bitcoin started a fresh decline from the $61,500 resistance zone.
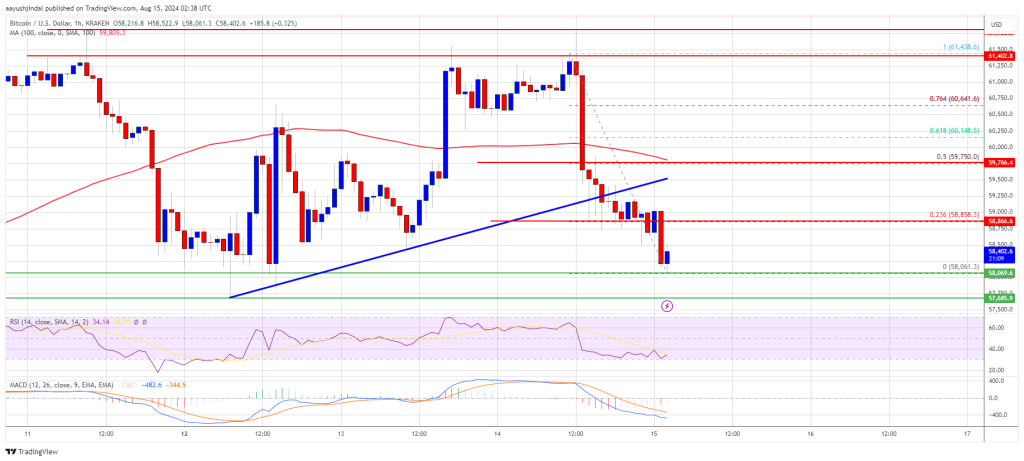
The price is trading below $60,000 and the 100 hourly Simple moving average.
There was a break below a key bullish trend line with support at $59,250 on the hourly chart of the BTC/USD pair (data feed from Kraken).
The pair might attempt a fresh increase if it stays above the $58,000 zone.
Bitcoin price failed to settle above the $61,500 resistance zone. BTC formed a short-term top and started a fresh decline below the $60,500 level. There was a move below the $60,000 and $59,000 levels.
Besides, there was a break below a key bullish trend line with support at $59,250 on the hourly chart of the BTC/USD pair. The pair retested the $58,000 support zone. A low is formed at $58,061 and the price is now consolidating losses.
Bitcoin price is now trading below $60,000 and the 100 hourly Simple moving average. On the upside, the price could face resistance near the $58,800 level. It is close to the 23.6% Fib retracement level of the downward move from the $61,438 swing high to the $58,061 low.
The first key resistance is near the $59,500 level or the 50% Fib retracement level of the downward move from the $61,438 swing high to the $58,061 low A clear move above the $59,500 resistance might send the price further higher in the coming sessions. The next key resistance could be $60,000.
The next major hurdle sits at $61,500. A close above the $61,500 resistance might spark more upsides. In the stated case, the price could rise and test the $63,500 resistance.
If Bitcoin fails to rise above the $58,800 resistance zone, it could continue to move down. Immediate support on the downside is near the $58,000 level.
The first major support is $57,650. The next support is now near the $56,500 zone. Any more losses might send the price toward the $55,500 support zone or even $55,000 in the near term.
Technical indicators:
Hourly MACD – The MACD is now gaining pace in the bearish zone.
Hourly RSI (Relative Strength Index) – The RSI for BTC/USD is now below the 50 level.
Major Support Levels – $58,000, followed by $57,650.
Major Resistance Levels – $58,800, and $59,500.
[#item_full_content]NewsBTCRead MoreStrategy (MSTR) reported a fourth-quarter net loss of $3.03 per share, compared to income of…
The world's largest asset management firm with more than $10 trillion in AUM, Blackrock (BLK)…
In an escalation of global economic friction, President Trump’s imposed tariffs have roiled financial markets…
Founder: Prashanth Chandrashekar Date Founded: March 2023 Location of Headquarters: Lithuania Number of Employees: 3…
BlackRock Inc., the world’s largest asset manager with over $11.5 trillion in assets under management,…
For decades, corporate treasuries have relied on cash, bonds and short-term investments to preserve capital.…