Bitcoin price started a fresh decline from the $60,000 resistance zone. BTC is now moving lower and might test the $57,650 support zone.
Bitcoin started a fresh decline from the $60,000 resistance zone.
The price is trading below $58,800 and the 100 hourly Simple moving average.
There was a break below a key bullish trend line with support at $59,700 on the hourly chart of the BTC/USD pair (data feed from Kraken).
The pair might attempt a fresh increase if it stays above the $57,650 zone.
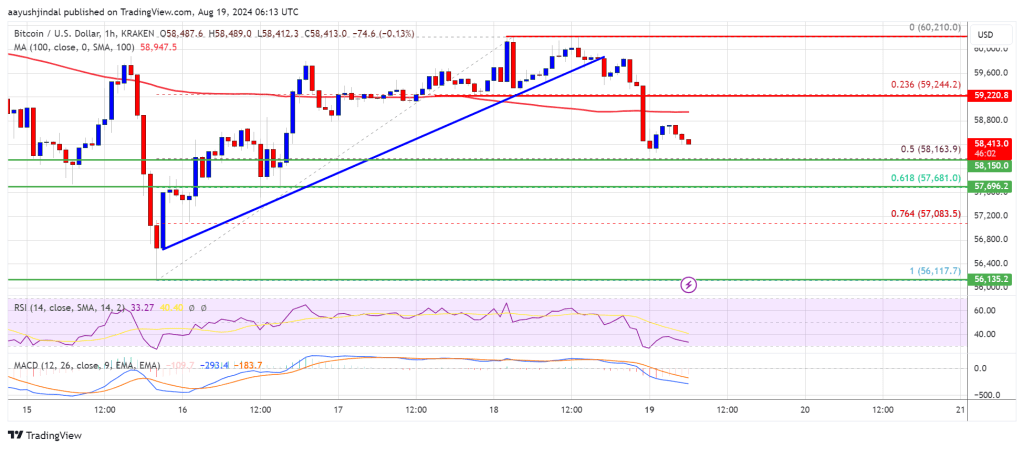
Bitcoin price struggled to settle above the $60,000 resistance zone. BTC formed a top near the $60,200 level before the price started a fresh decline. There was a move below the $58,500 support zone.
The price declined below the 23.6% Fib retracement level of the upward move from the $56,117 swing low to the $60,210 high. Besides, there was a break below a key bullish trend line with support at $59,700 on the hourly chart of the BTC/USD pair.
The pair retested the $58,000 support zone. Bitcoin price is now trading below $59,000 and the 100 hourly Simple moving average. However, the price is still above the 50% Fib retracement level of the upward move from the $56,117 swing low to the $60,210 high.
On the upside, the price could face resistance near the $58,800 level. The first key resistance is near the $59,500 level. A clear move above the $59,500 resistance might send the price further higher in the coming sessions. The next key resistance could be $60,000.
A close above the $60,000 resistance might spark more upsides. In the stated case, the price could rise and test the $61,500 resistance.
If Bitcoin fails to rise above the $58,800 resistance zone, it could continue to move down. Immediate support on the downside is near the $58,000 level.
The first major support is $57,650. The next support is now near the $57,000 zone. Any more losses might send the price toward the $55,500 support zone or even $55,000 in the near term.
Technical indicators:
Hourly MACD – The MACD is now gaining pace in the bearish zone.
Hourly RSI (Relative Strength Index) – The RSI for BTC/USD is now below the 50 level.
Major Support Levels – $58,000, followed by $57,650.
Major Resistance Levels – $58,800, and $59,500.
[#item_full_content]NewsBTCRead MoreBitcoin (BTC) continues to move within its one-week range after recovering from its recent drop…
Alexander Vinnik, the jailed former operator of once mighty bitcoin exchange BTC-e, is being released…
Founder: Nicolas Burtey Date Founded: September 2019 Location of Headquarters: United States Number of Employees:…
Bitcoin Twitter (or Bitcoin X) is having a moment after a 13F filing by Goldman…
After a relatively subdued price performance in 2024, Ethereum (ETH) could be on the verge…
In El Salvador, about two hours away from the capital, up in the mountains, lies…