TA: Bitcoin Attempts Fresh Increase, Why Upsides Remain Capped
Bitcoin attempted a fresh increase above $39,500 against the US Dollar. BTC is still facing a strong resistance near $39,800 and $40,000.
Bitcoin spiked above $39,500, but it failed to clear the $40,000 resistance zone.
The price is trading near $39,000 and the 100 hourly simple moving average.
There was a break above a key bearish trend line with resistance near $38,750 on the hourly chart of the BTC/USD pair (data feed from Kraken).
The pair must clear the $39,800 and $40,000 resistance levels to start a fresh increase.
Bitcoin Price Faces Hurdle
Bitcoin price started a recovery wave above the $38,200 resistance level. BTC even spiked above the $38,500 resistance level, but it faced a strong resistance.
During the recovery, there was a break above a key bearish trend line with resistance near $38,750 on the hourly chart of the BTC/USD pair. The pair climbed above the $39,800 level and the 100 hourly simple moving average. However, it faced a strong resistance just below the $40,000 level.
A high was formed near $39,899 and the price corrected gains. There was a move below the $39,500 level. Bitcoin declined below the 23.6% Fib retracement level of the upward move from the $37,593 swing low to $39,899 high.
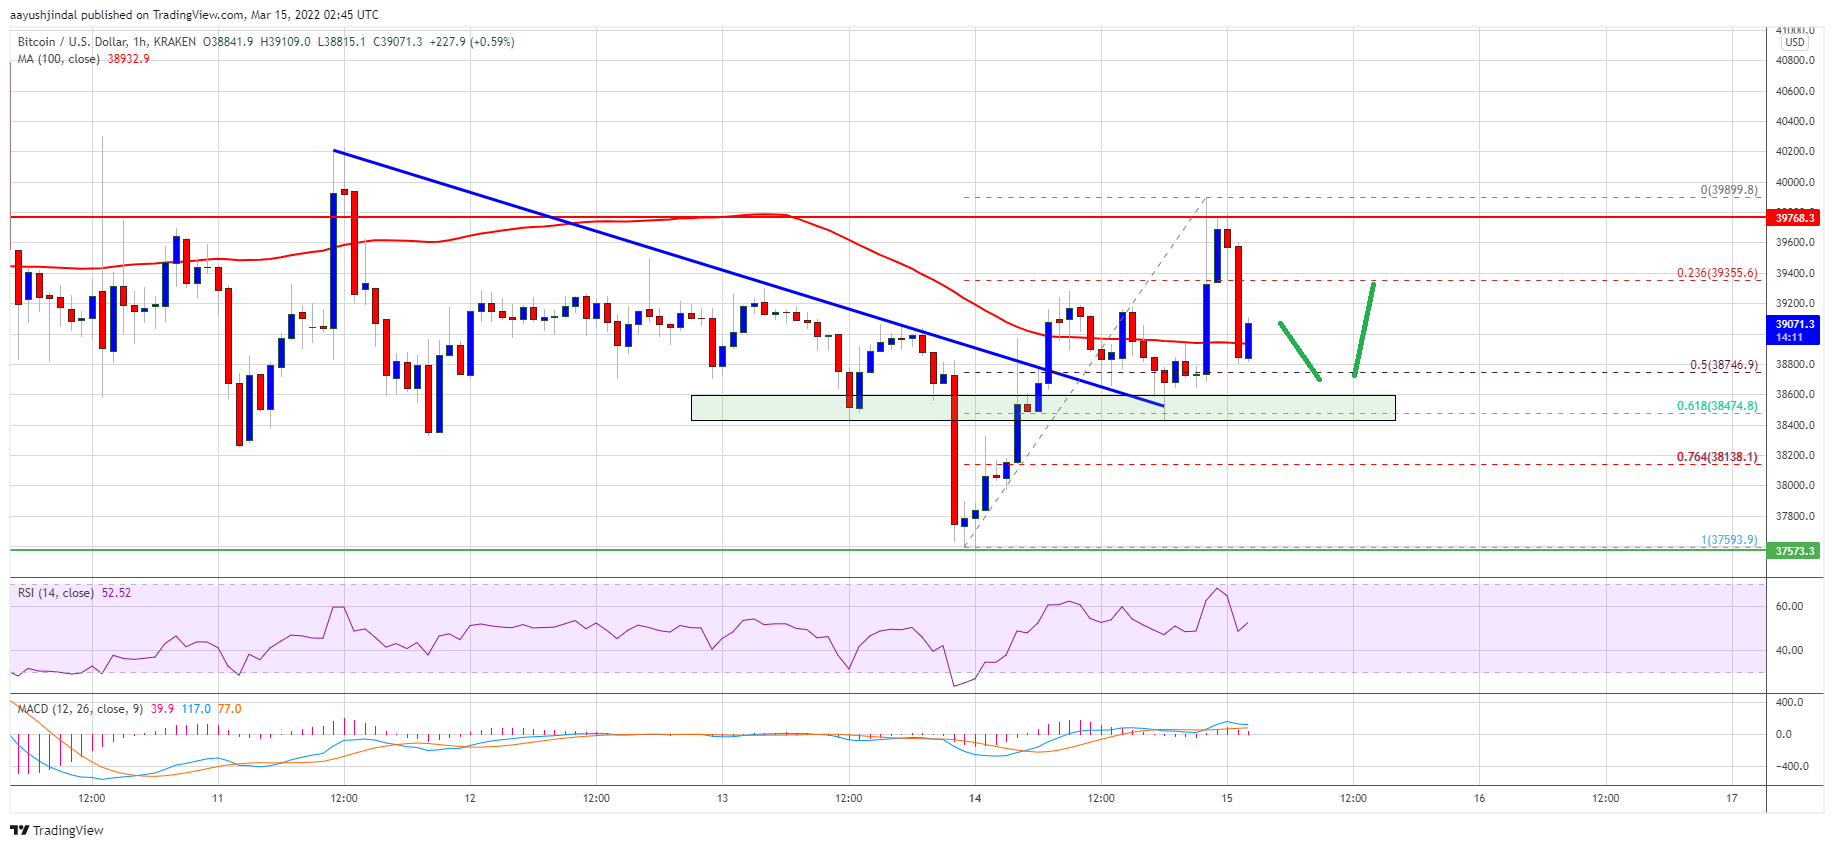
It is now trading near $39,000 and the 100 hourly simple moving average. An immediate resistance on the upside is near the $39,550 zone. The next major resistance could be near the recent high or $39,900. The main breakout resistance is still near the $40,000 zone.
Source: BTCUSD on TradingView.com
A close above the $40,000 resistance zone could open the doors for a steady increase. In the stated case, the price could rise towards the $42,000 resistance zone.
Fresh Decline in BTC?
If bitcoin fails to clear the $39,550 resistance zone, it could continue to move down. An immediate support on the downside is near the $39,000 zone.
The next major support is seen near the $38,750 level. It is near the 50% Fib retracement level of the upward move from the $37,593 swing low to $39,899 high. The main support sits near the $38,500 level, below which there is a risk of a sharp decline.
Technical indicators:
Hourly MACD – The MACD is now losing pace in the bullish zone.
Hourly RSI (Relative Strength Index) – The RSI for BTC/USD is now above the 50 level.
Major Support Levels – $38,750, followed by $38,500.
Major Resistance Levels – $39,550, $39,900 and $40,000.
Bitcoin attempted a fresh increase above $39,500 against the US Dollar. BTC is still facing a strong resistance near $39,800 and $40,000.
Bitcoin spiked above $39,500, but it failed to clear the $40,000 resistance zone.
The price is trading near $39,000 and the 100 hourly simple moving average.
There was a break above a key bearish trend line with resistance near $38,750 on the hourly chart of the BTC/USD pair (data feed from Kraken).
The pair must clear the $39,800 and $40,000 resistance levels to start a fresh increase.
Bitcoin Price Faces Hurdle
Bitcoin price started a recovery wave above the $38,200 resistance level. BTC even spiked above the $38,500 resistance level, but it faced a strong resistance.
During the recovery, there was a break above a key bearish trend line with resistance near $38,750 on the hourly chart of the BTC/USD pair. The pair climbed above the $39,800 level and the 100 hourly simple moving average. However, it faced a strong resistance just below the $40,000 level.
A high was formed near $39,899 and the price corrected gains. There was a move below the $39,500 level. Bitcoin declined below the 23.6% Fib retracement level of the upward move from the $37,593 swing low to $39,899 high.
It is now trading near $39,000 and the 100 hourly simple moving average. An immediate resistance on the upside is near the $39,550 zone. The next major resistance could be near the recent high or $39,900. The main breakout resistance is still near the $40,000 zone.
Source: BTCUSD on TradingView.com
A close above the $40,000 resistance zone could open the doors for a steady increase. In the stated case, the price could rise towards the $42,000 resistance zone.
Fresh Decline in BTC?
If bitcoin fails to clear the $39,550 resistance zone, it could continue to move down. An immediate support on the downside is near the $39,000 zone.
The next major support is seen near the $38,750 level. It is near the 50% Fib retracement level of the upward move from the $37,593 swing low to $39,899 high. The main support sits near the $38,500 level, below which there is a risk of a sharp decline.
Technical indicators:
Hourly MACD – The MACD is now losing pace in the bullish zone.
Hourly RSI (Relative Strength Index) – The RSI for BTC/USD is now above the 50 level.
Major Support Levels – $38,750, followed by $38,500.
Major Resistance Levels – $39,550, $39,900 and $40,000.
Tags: bitcoinbtcusdBTCUSDTxbtusd
FeedzyRead More


Recent Posts
Bitcoin Soars Toward $100,000 As Treasury, Not Fed, Drives Liquidity: Expert
Arthur Hayes, the co-founder of BitMEX and principal of Maelstrom Capital, contends that the US…
Ether-Bitcoin Ratio Signals ETH is ‘Extremely Undervalued,’ But Headwinds Remain: CryptoQuant
The ether-bitcoin (ETH/BTC) ratio has reached an “extremely undervalued” zone in a move that flashes…
Strive Reveals New Bitcoin Treasury Blueprint at Strategy World 2025
Bitcoin Magazine Strive Reveals New Bitcoin Treasury Blueprint at Strategy World 2025 A new kind…
Dogecoin, Cardano’s ADA Lead Market Gains as Bitcoin Traders Eye Next Fed Meeting
Bitcoin (BTC) flirted with $100,000 Thursday as major cryptocurrencies including dogecoin (DOGE) and Cardano’s ADA…
Bitcoin’s Realized Cap Hits Record High as Accumulation Continues
Bitcoin is currently trading just under the $100,000 psychological threshold, maintaining a sideways trajectory in…
What’s Next for Bitcoin With Crypto Market Cheering Trump’s Trade Deal Hype?
Bitcoin (BTC) is fast closing on the $100,000 mark as U.S. President Donald Trump teased…