Bitcoin started a sharp recovery wave from $39,700 against the US Dollar. BTC is rising and the next major stop for the bulls might be $43,500.
Bitcoin spiked towards the $39,600 level, where the bulls took a stand.
The price is trading above $42,000 and the 100 hourly simple moving average.
There was a break above a key bearish trend line with resistance near $41,800 on the hourly chart of the BTC/USD pair (data feed from Kraken).
The pair might continue to recover and test the $43,500 resistance zone in the near term.
Bitcoin Price Recovers Sharply
Bitcoin price extended decline below the $40,500 support level. BTC even spiked below the $40,000 level and traded as low as $39,659.
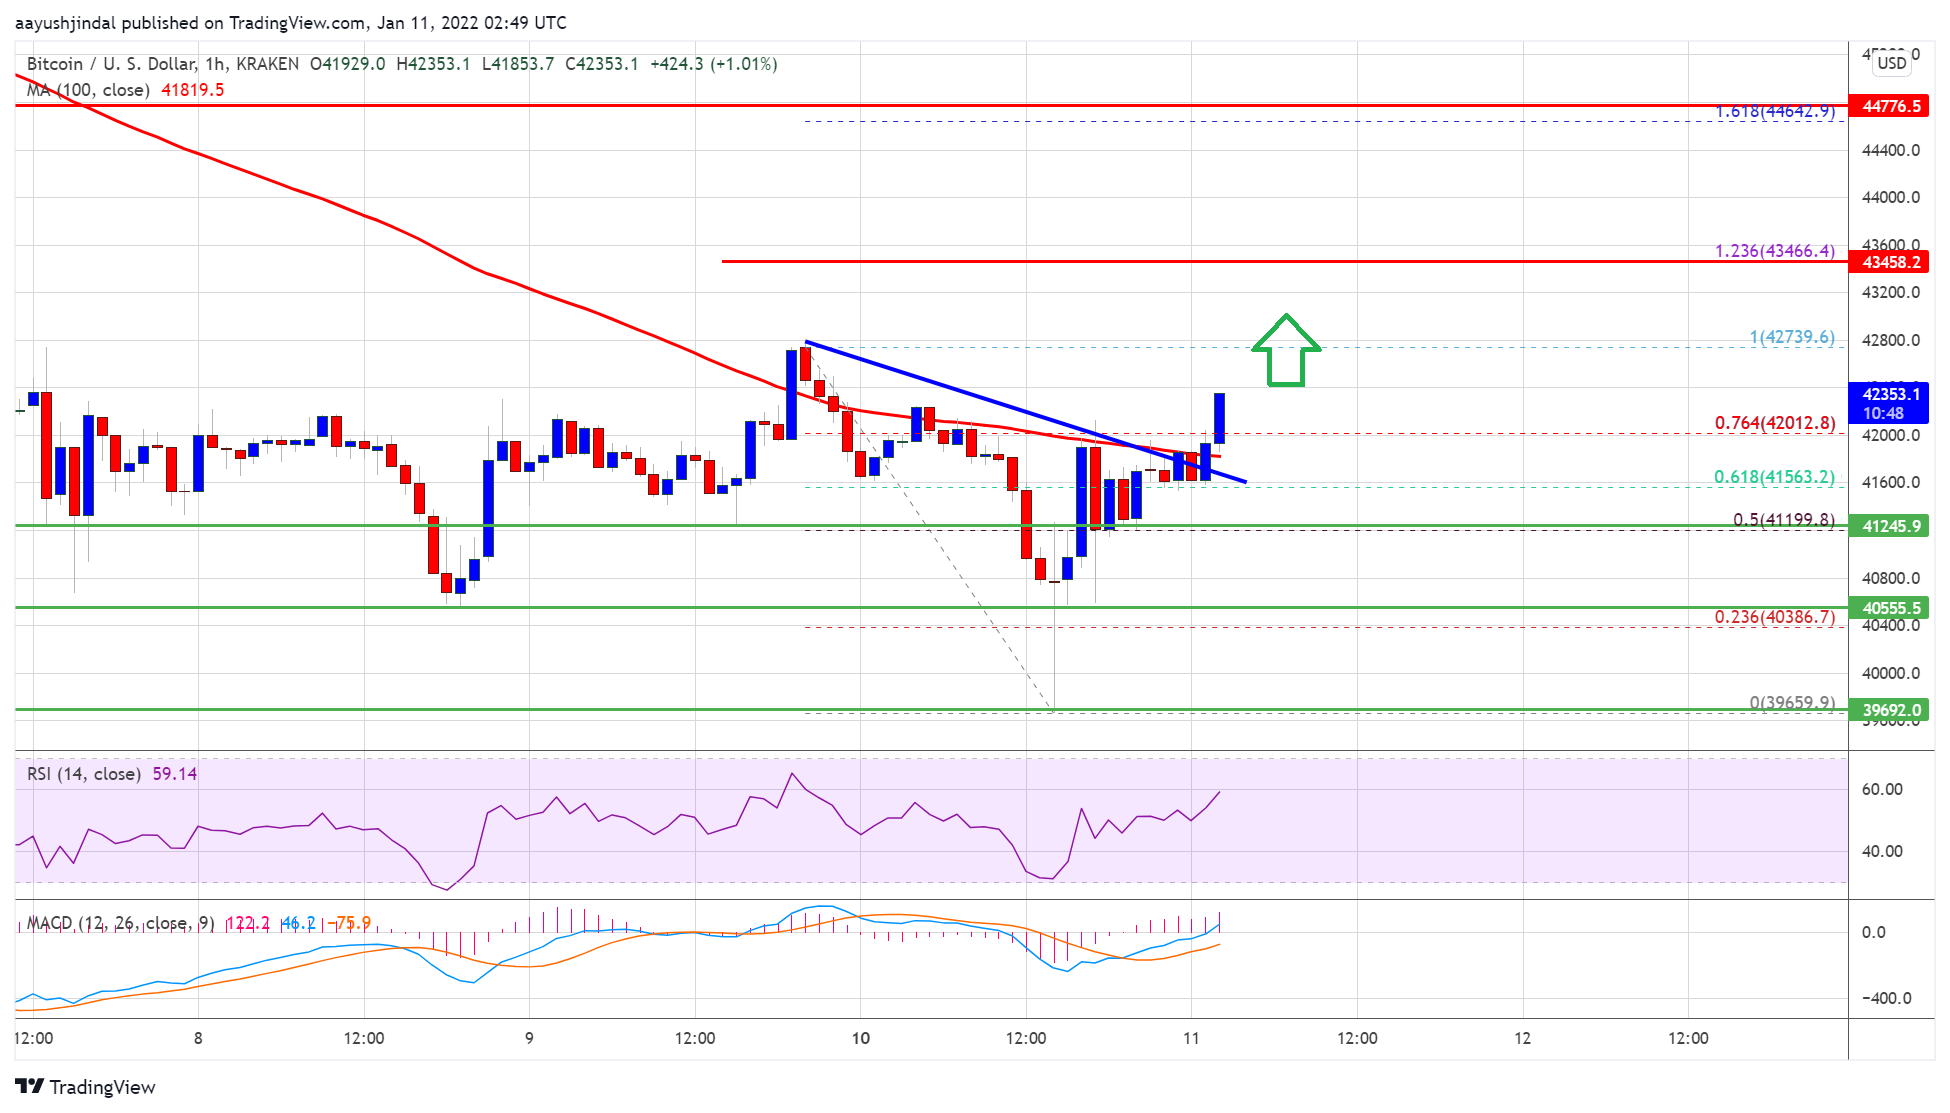
Recently, there was a sharp recovery wave above the $40,000 level. The price climbed higher above the $40,500 and $41,200 resistance levels. The bulls even pushed the price above the 50% Fib retracement level of the recent decline from the $42,739 swing high to $39,659 low.
Besides, there was a break above a key bearish trend line with resistance near $41,800 on the hourly chart of the BTC/USD pair. Bitcoin is now trading above $42,000 and the 100 hourly simple moving average.
Source: BTCUSD on TradingView.com
On the upside, the first major resistance is near the $42,750 level. The next major resistance is near the $43,500 level. It is near the 1.236 Fib extension level of the recent decline from the $42,739 swing high to $39,659 low. Any more gains could pump the price towards the $44,500 level. The next major resistance is near the $45,500 level, where the bears might emerge.
Fresh Decline in BTC?
If bitcoin fails to recover above $43,500, it could start a fresh decline. An immediate support on the downside is near the $41,800 zone and the 100 hourly SMA.
The first major support is near $41,500 and the broken trend line. A downside break below the trend line support could lead the price towards the $41,000 level. Any more losses might push the price towards the $40,000 support zone in the coming sessions.
Technical indicators:
Hourly MACD – The MACD is now gaining pace in the bullish zone.
Hourly RSI (Relative Strength Index) – The RSI for BTC/USD is now above the 50 level.
Major Support Levels – $41,500, followed by $40,500.
Major Resistance Levels – $42,750, $43,000 and $43,500.
Bitcoin started a sharp recovery wave from $39,700 against the US Dollar. BTC is rising and the next major stop for the bulls might be $43,500.
Bitcoin spiked towards the $39,600 level, where the bulls took a stand.
The price is trading above $42,000 and the 100 hourly simple moving average.
There was a break above a key bearish trend line with resistance near $41,800 on the hourly chart of the BTC/USD pair (data feed from Kraken).
The pair might continue to recover and test the $43,500 resistance zone in the near term.
Bitcoin price extended decline below the $40,500 support level. BTC even spiked below the $40,000 level and traded as low as $39,659.
Recently, there was a sharp recovery wave above the $40,000 level. The price climbed higher above the $40,500 and $41,200 resistance levels. The bulls even pushed the price above the 50% Fib retracement level of the recent decline from the $42,739 swing high to $39,659 low.
Besides, there was a break above a key bearish trend line with resistance near $41,800 on the hourly chart of the BTC/USD pair. Bitcoin is now trading above $42,000 and the 100 hourly simple moving average.
Source: BTCUSD on TradingView.com
On the upside, the first major resistance is near the $42,750 level. The next major resistance is near the $43,500 level. It is near the 1.236 Fib extension level of the recent decline from the $42,739 swing high to $39,659 low. Any more gains could pump the price towards the $44,500 level. The next major resistance is near the $45,500 level, where the bears might emerge.
If bitcoin fails to recover above $43,500, it could start a fresh decline. An immediate support on the downside is near the $41,800 zone and the 100 hourly SMA.
The first major support is near $41,500 and the broken trend line. A downside break below the trend line support could lead the price towards the $41,000 level. Any more losses might push the price towards the $40,000 support zone in the coming sessions.
Technical indicators:
Hourly MACD – The MACD is now gaining pace in the bullish zone.
Hourly RSI (Relative Strength Index) – The RSI for BTC/USD is now above the 50 level.
Major Support Levels – $41,500, followed by $40,500.
Major Resistance Levels – $42,750, $43,000 and $43,500.
Tags: bitcoinbtcusdBTCUSDTxbtusd
FeedzyRead More
Bitcoin price started a fresh decline below the $90,000 support. BTC must stay above the…
Earlier this morning, Bitcoin (BTC) hit a yearly low of $86,888 amid a broader market…
Bitcoin (BTC), the market’s leading cryptocurrency, has officially entered a new downtrend phase following a…
On-chain data shows the number of Bitcoin loss addresses has shot up following the cryptocurrency’s…
Bitcoin Magazine The University of Austin (UATX) Partners with the Texas Bitcoin Foundation, Bitcoin Policy…
Bitcoin Magazine Voltage Aims To Bring Bitcoin’s Lightning Network To Every Business In The World…