TA: Bitcoin Breaks Key Support, Why BTC Could Dive Below $40K
Bitcoin started a fresh decline from well above the $44,000 level against the US Dollar. BTC broke the $42,500 support and remains at a risk of more downsides.
Bitcoin traded below an important support zone at $42,500.
The price is trading below $42,500 and the 100 hourly simple moving average.
There is a key bearish trend line forming with resistance near $42,200 on the hourly chart of the BTC/USD pair (data feed from Kraken).
The pair could decline further if it fails to recover above the $42,800 zone.
Bitcoin Price Extends Decline
Bitcoin price failed to clear the $45,500 resistance and started a major decline. BTC traded below the $43,200 and USD 42,500 support levels to move into a short-term bearish zone.
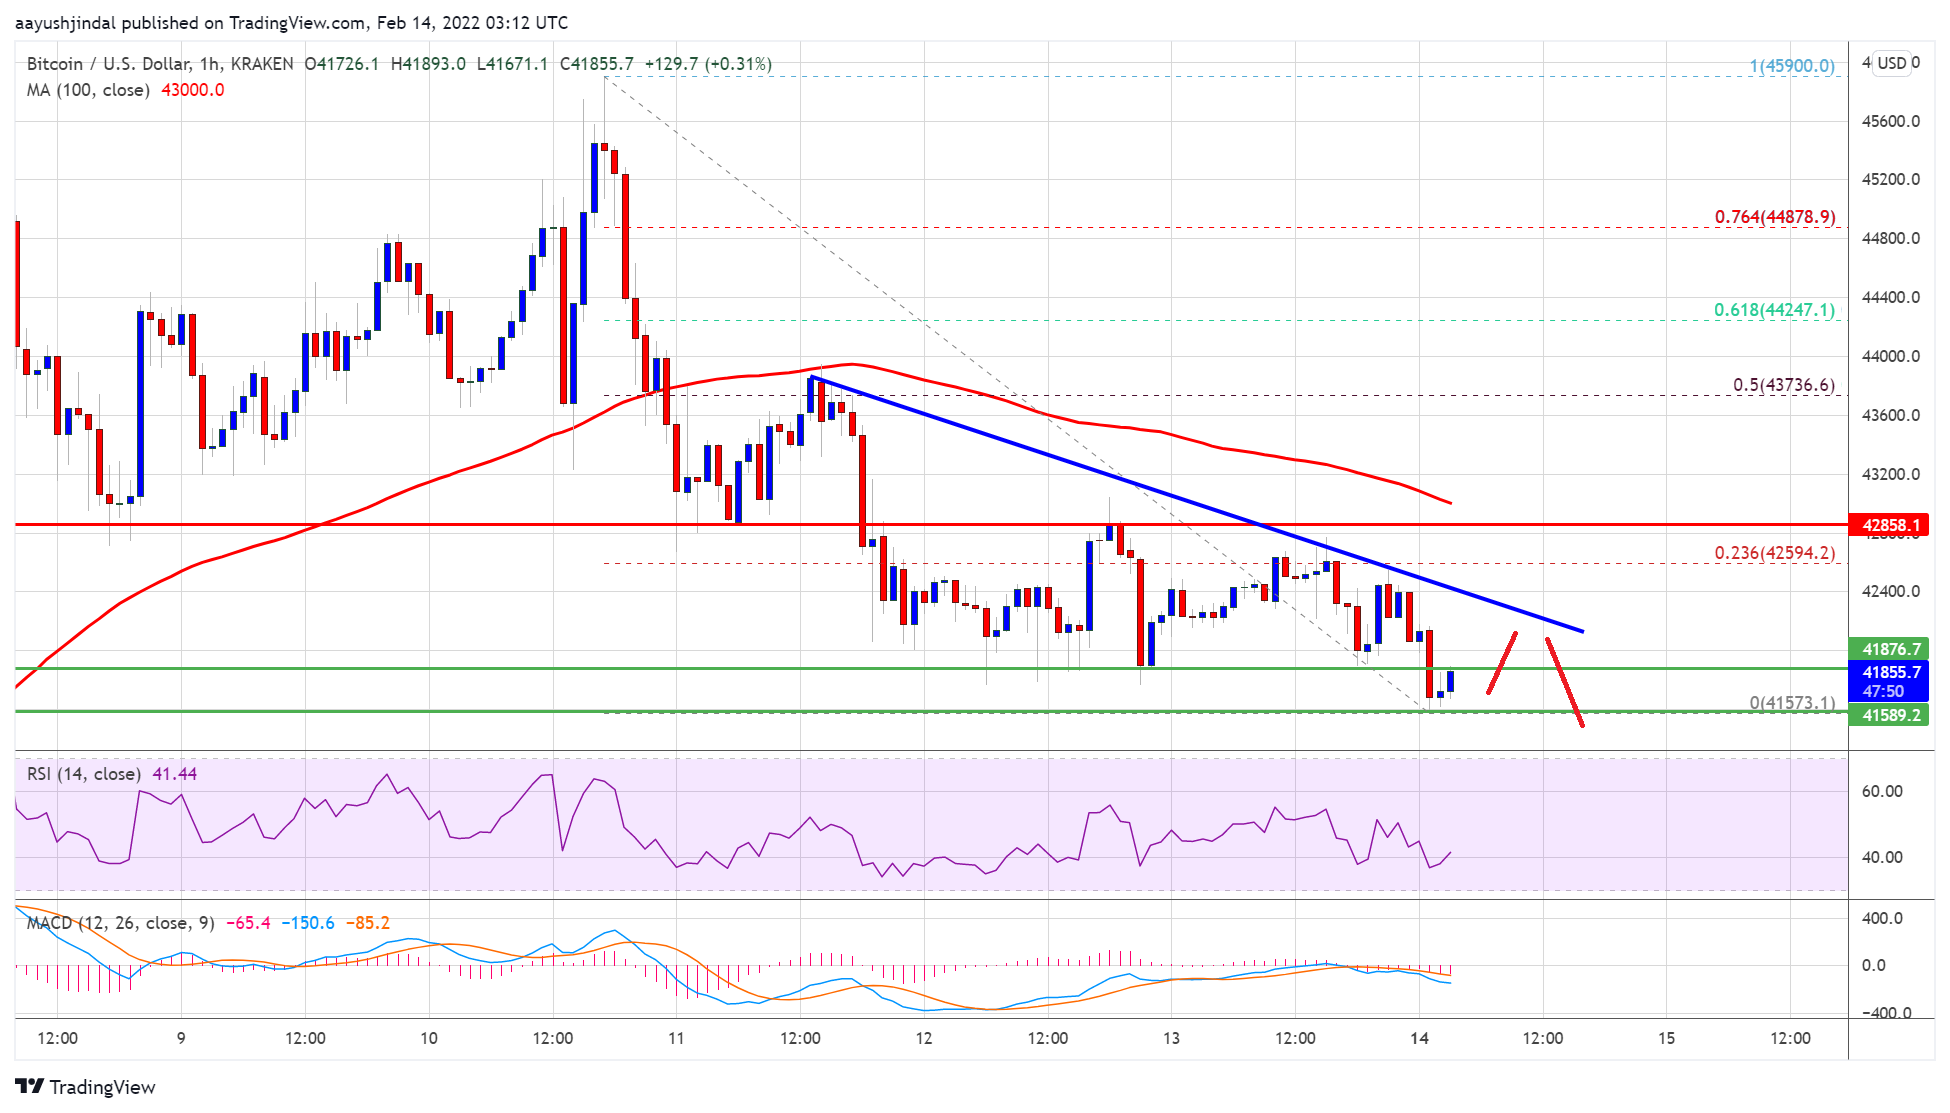
There was also a close below the $42,50 level and the 100 hourly simple moving average. A low was formed near $41,573 and the price is now consolidating losses. An immediate resistance is near the $42,000 level. The first major resistance is near the $42,200 level.
Besides, there is also a key bearish trend line forming with resistance near $42,200 on the hourly chart of the BTC/USD pair. The next key resistance could be $42,500 or the 23.6% Fib retracement level of the recent decline from the $45,900 high to $41,573 low.
Source: BTCUSD on TradingView.com
The main resistance seems to be forming near the $42,850 level or the 100 hourly simple moving average. A clear move above the 100 hourly simple moving average might send the price to $43,750. It is near the 50% Fib retracement level of the recent decline from the $45,900 high to $41,573 low.
More Losses in BTC?
If bitcoin fails to start a fresh increase above $42,850, it could continue to move down. An immediate support on the downside is near the $41,600 zone.
The next major support is seen near the $41,200 level. If there is a downside break below the $41,200 support, the price could start a major decline towards the $40,000 level.
Technical indicators:
Hourly MACD – The MACD is now gaining pace in the bearish zone.
Hourly RSI (Relative Strength Index) – The RSI for BTC/USD is now below the 50 level.
Major Support Levels – $41,600, followed by $41,200.
Major Resistance Levels – $42,200, $42,850 and $43,000.
Bitcoin started a fresh decline from well above the $44,000 level against the US Dollar. BTC broke the $42,500 support and remains at a risk of more downsides.
Bitcoin traded below an important support zone at $42,500.
The price is trading below $42,500 and the 100 hourly simple moving average.
There is a key bearish trend line forming with resistance near $42,200 on the hourly chart of the BTC/USD pair (data feed from Kraken).
The pair could decline further if it fails to recover above the $42,800 zone.
Bitcoin Price Extends Decline
Bitcoin price failed to clear the $45,500 resistance and started a major decline. BTC traded below the $43,200 and USD 42,500 support levels to move into a short-term bearish zone.
There was also a close below the $42,50 level and the 100 hourly simple moving average. A low was formed near $41,573 and the price is now consolidating losses. An immediate resistance is near the $42,000 level. The first major resistance is near the $42,200 level.
Besides, there is also a key bearish trend line forming with resistance near $42,200 on the hourly chart of the BTC/USD pair. The next key resistance could be $42,500 or the 23.6% Fib retracement level of the recent decline from the $45,900 high to $41,573 low.
Source: BTCUSD on TradingView.com
The main resistance seems to be forming near the $42,850 level or the 100 hourly simple moving average. A clear move above the 100 hourly simple moving average might send the price to $43,750. It is near the 50% Fib retracement level of the recent decline from the $45,900 high to $41,573 low.
More Losses in BTC?
If bitcoin fails to start a fresh increase above $42,850, it could continue to move down. An immediate support on the downside is near the $41,600 zone.
The next major support is seen near the $41,200 level. If there is a downside break below the $41,200 support, the price could start a major decline towards the $40,000 level.
Technical indicators:
Hourly MACD – The MACD is now gaining pace in the bearish zone.
Hourly RSI (Relative Strength Index) – The RSI for BTC/USD is now below the 50 level.
Major Support Levels – $41,600, followed by $41,200.
Major Resistance Levels – $42,200, $42,850 and $43,000.
Tags: bitcoinbtcusdBTCUSDTxbtusd
FeedzyRead More


Recent Posts
Michael Saylor’s $84 Billion Bitcoin Bet: How Is Strategy Doing On Its Current BTC Holdings?
Michael Saylor’s Bitcoin-first investment strategy has once again taken the spotlight after Strategy (formerly MicroStrategy)…
Bitcoin At Critical Juncture – Price Levels To Watch: Analyst
Bitcoin maintains its bullish form from April as it gains by over 4% in the…
Analyst Says Bitcoin’s Most Crucial Support Level Is At $91,200 — What’s Next?
The price of Bitcoin has started the month of May with a similar bullish impetus…
Bitcoin Price Trading Within Dense Supply Cluster — What Lies Beyond $100K?
After two weeks of strong action, the Bitcoin price seems to be back on the…
Bitcoin To Infinity? Venture Capitalist Says Crypto’s Value Vs. Dollar Has No Ceiling
The dollar is weakening this year. As reported, the US dollar index declined 7% year-to-date,…
Arizona Governor Calls Crypto an ‘Untested Investment,’ Vetoes Bitcoin Reserve Bill
Arizona will not be investing in bitcoin (BTC), at least not this year. Governor Katie…