Bitcoin spiked to test the $45,000 resistance against the US Dollar. BTC is consolidating gains and might correct lower towards $43,000 in the near term.
Bitcoin extended increase and traded close to the $45,000 resistance zone.
The price is trading above $44,000 and the 100 hourly simple moving average.
There is a key contracting triangle forming with resistance near $44,450 on the hourly chart of the BTC/USD pair (data feed from Kraken).
The pair could correct lower if there is a move below the $43,000 support zone.
Bitcoin Price Extends Rally
Bitcoin price started a major increase above the $42,000 level. BTC was able to stay above the $43,000 level and consolidating near $44,000.
Finally, there was another increase and the price climbed above $44,500. The price traded close the $45,000 resistance, where it faced sellers. It is now consolidating gains and there was a minor decline below the $44,500 level.
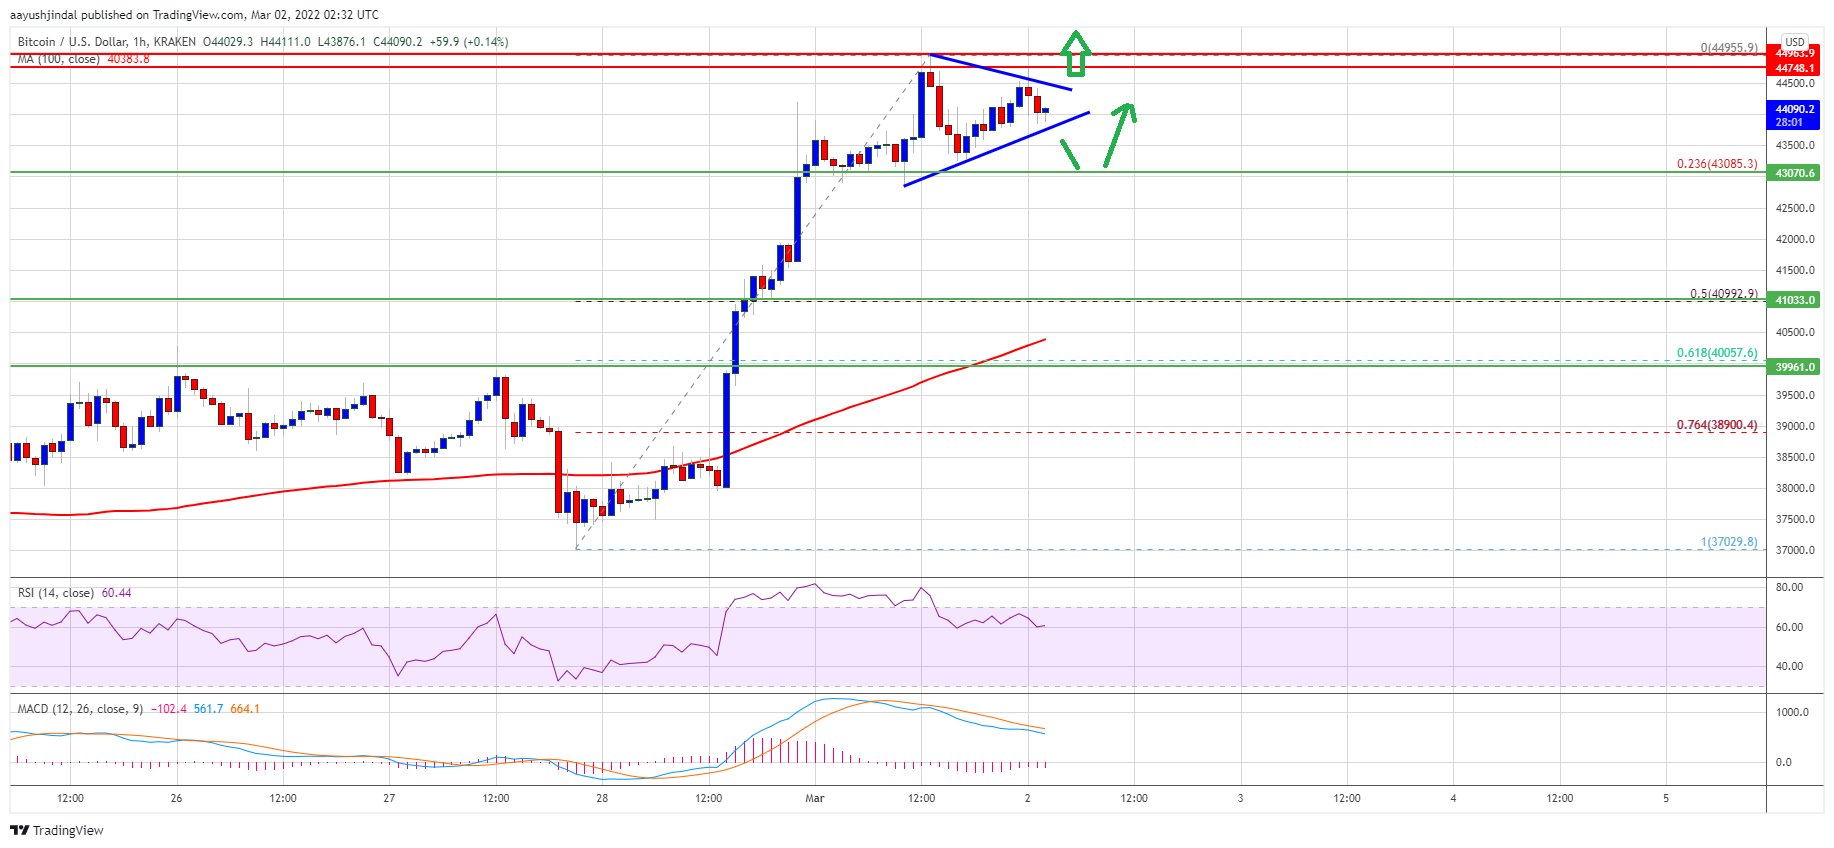
The price is now trading above $44,000 and the 100 hourly simple moving average. It is also well above the 23.6% Fib retracement level of the upward move from the $37,030 swing low to $44,955 high.
There is also a key contracting triangle forming with resistance near $44,450 on the hourly chart of the BTC/USD pair. Bitcoin is now facing resistance is near the $44,200 level. The first key resistance is near the $44,450 level and the triangle upper trend line.
Source: BTCUSD on TradingView.com
The main resistance is now near the $45,000 level. A clear move above the $45,000 resistance could send the price further higher. In the stated case, it could even attempt a clear move above $45,500.
Dips Limited in BTC?
If bitcoin fails to clear the $44,500 resistance zone, it could start a downside correction. An immediate support on the downside is near the $43,800 zone and the triangle lower trend line.
The next major support is seen near the $43,000 level. If there is a downside break below the $43,000 support, the price might gain decline towards $41,000. It is near the 50% Fib retracement level of the upward move from the $37,030 swing low to $44,955 high.
Technical indicators:
Hourly MACD – The MACD is now losing pace in the bullish zone.
Hourly RSI (Relative Strength Index) – The RSI for BTC/USD is still correcting from the overbought zone.
Major Support Levels – $43,800, followed by $43,000.
Major Resistance Levels – $44,200, $44,450 and $45,000.
Bitcoin spiked to test the $45,000 resistance against the US Dollar. BTC is consolidating gains and might correct lower towards $43,000 in the near term.
Bitcoin extended increase and traded close to the $45,000 resistance zone.
The price is trading above $44,000 and the 100 hourly simple moving average.
There is a key contracting triangle forming with resistance near $44,450 on the hourly chart of the BTC/USD pair (data feed from Kraken).
The pair could correct lower if there is a move below the $43,000 support zone.
Bitcoin price started a major increase above the $42,000 level. BTC was able to stay above the $43,000 level and consolidating near $44,000.
Finally, there was another increase and the price climbed above $44,500. The price traded close the $45,000 resistance, where it faced sellers. It is now consolidating gains and there was a minor decline below the $44,500 level.
The price is now trading above $44,000 and the 100 hourly simple moving average. It is also well above the 23.6% Fib retracement level of the upward move from the $37,030 swing low to $44,955 high.
There is also a key contracting triangle forming with resistance near $44,450 on the hourly chart of the BTC/USD pair. Bitcoin is now facing resistance is near the $44,200 level. The first key resistance is near the $44,450 level and the triangle upper trend line.
Source: BTCUSD on TradingView.com
The main resistance is now near the $45,000 level. A clear move above the $45,000 resistance could send the price further higher. In the stated case, it could even attempt a clear move above $45,500.
If bitcoin fails to clear the $44,500 resistance zone, it could start a downside correction. An immediate support on the downside is near the $43,800 zone and the triangle lower trend line.
The next major support is seen near the $43,000 level. If there is a downside break below the $43,000 support, the price might gain decline towards $41,000. It is near the 50% Fib retracement level of the upward move from the $37,030 swing low to $44,955 high.
Technical indicators:
Hourly MACD – The MACD is now losing pace in the bullish zone.
Hourly RSI (Relative Strength Index) – The RSI for BTC/USD is still correcting from the overbought zone.
Major Support Levels – $43,800, followed by $43,000.
Major Resistance Levels – $44,200, $44,450 and $45,000.
Tags: bitcoinbtcusdBTCUSDTxbtusd
FeedzyRead More
Bitcoin (BTC) miners listed in the U.S. are growing their share of the network hashrate,…
Metaplanet (3350) said it bought a further 269.43 bitcoin (BTC), strengthening its position as a…
The U.S. crypto task force will focus on starting up a national bitcoin (BTC) reserve,…
Bitcoin (BTC) has been relatively listless this month, hunching below $100,000. However, this hasn't deterred…
Changing macroeconomic conditions and big investment activity are driving Bitcoin near the crucial $97,000 resistance…
Bitcoin price is struggling to clear the $100,000 resistance zone. BTC is again moving lower…